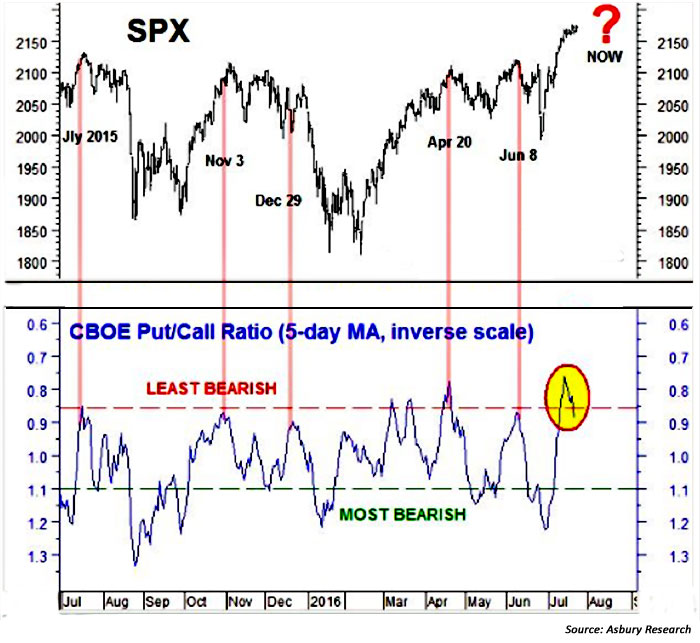
FIGURE 1: CBOE VOLATILITY INDEX BEFORE AND AFTER THE BREXIT VOTE
For the month of July, the VIX has been on an almost uninterrupted path lower. In fact, says Bespoke Investment Group, “Like a little kid coming off a sugar high, volatility has seen an outright collapse. After closing above 25 on 6/24, the VIX closed below 12 this past Tuesday (July 19), marking the quickest decline from a 25+ reading down to a sub 12 reading on record.”
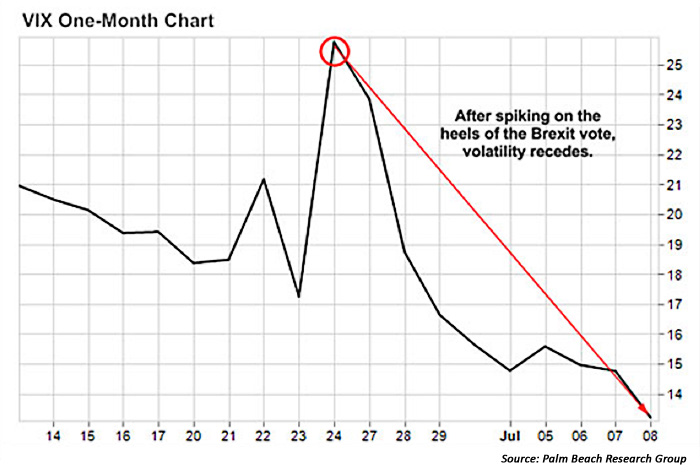
FIGURE 2: VIX INDEX (2014–2016)
Despite August having been a relatively poor performing month over the past few years (Barron’s cites four out of the past six Augusts as down months), Bespoke sees a historical precedent that could be quite positive for the overall U.S. equity market:
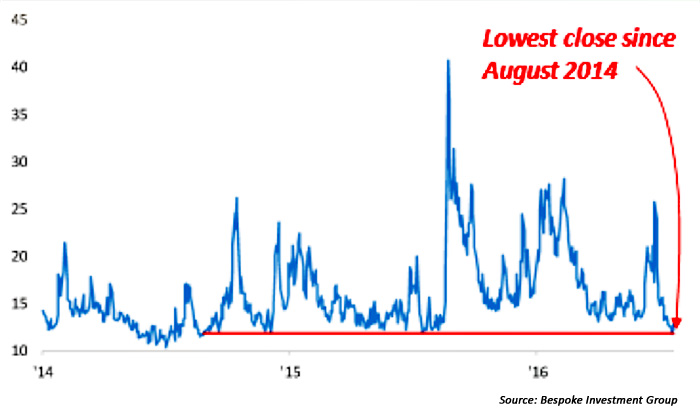
“In the span of two trading days, the S&P 500 went from 1.6 standard deviations above its 50-DMA to 3.2 standard deviations below. In the index’s entire history, there has never been a larger decline in the index’s OB/OS (Overbought/Oversold) reading in that short a period of time.
“As if that move wasn’t major enough, the rebound that followed was nearly as monumental. In the span of ten trading days, the S&P 500 went from 3.2 standard deviations below its 50-DMA to 2.5 above. That 5.7 point ten-day move in the index’s OB/OS reading was only eclipsed one other time in the S&P 500’s history, and that was 8/23/1982. If you know anything about market history, you know that August 1982 was a good time to get long equities.”
FIGURE 3: S&P 500 PRICE VS. TRADING RANGE (LAST 12 MONTHS)
Asbury Research’s intermediate-term outlook for the market remains positive as of July 25, “based on chart patterns with unmet upside targets in several US indexes, as well as some positively correlated overseas indexes like the London FTSE 100 and Taiwan Weighted Index.”
However, Asbury’s wrap-up last week pointed to one potential warning flag for some possible short-term choppy market action and perhaps a sharp pullback:
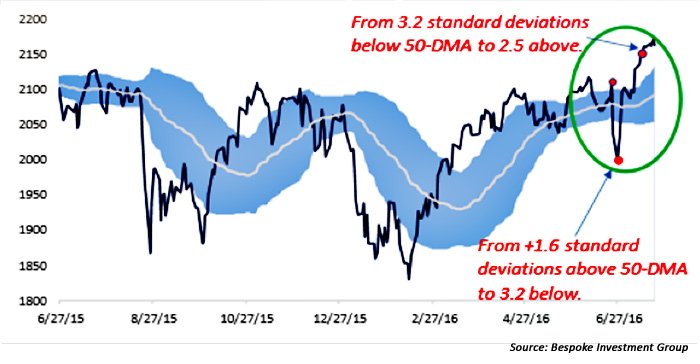
“In last week’s report we pointed out that the CBOE Put/Call Ratio (5-day moving average, inverse scale) had reached a least bearish extreme—indicating historically low put volume versus call volume—that had previously coincided with or closely led most of the near term peaks in the S&P 500 during the past year. … An updated version of that chart shows that this metric continues to hover at those same least bearish extremes. …This metric continues to warn that further upside in SPX is likely to be limited at best without at least a minor pullback first.”
FIGURE 4: S&P 500 (SPX) VS. CBOE PUT/CALL RATIO