

In this week’s “How I See It” market commentary, Tony Dwyer of Canaccord Genuity speaks about how the “Trump trade” has faded quite significantly over the past several weeks.
May 8, 2017, marked the six-month point from the 2016 U.S. presidential election, and it certainly has been an interesting period for Washington and international developments. Major policy disagreements domestically, the Russian intrigue, political uncertainty in several nations, and threats from North Korea have dominated the headlines.
In the face of this challenging backdrop, what does the “market scorecard” since the November 2016 election say?
Bespoke Investment Group recently reviewed this period from a market perspective. A few of the key findings are summarized below.
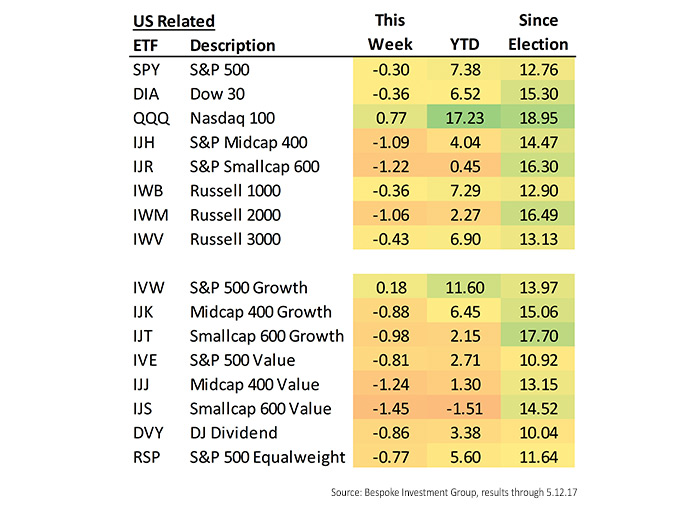
- All major U.S. equity indexes are up “massively” since the election, despite range-bound trading during much of March, April, and May 2017.
FIGURE 1: U.S. EQUITY INDEX PERFORMANCE SINCE NOV. 8, 2016
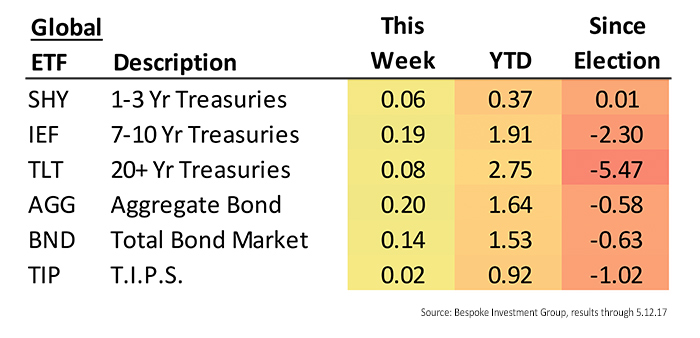
- While most bond indexes have recovered somewhat in 2017, almost all are down since the election.
FIGURE 2: U.S BOND INDEX PERFORMANCE SINCE NOV. 8, 2016
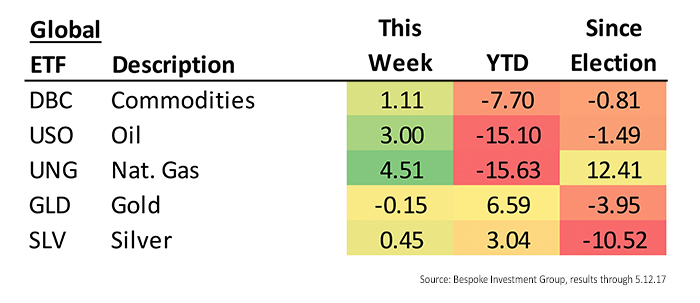
- Commodity indexes have generally performed much worse in 2017 than the post-election period, although metals have rebounded this year.
FIGURE 3: U.S. COMMODITY/METALS INDEXES SINCE NOV. 8, 2016
- The best-performing stocks since the election have been the ones with the highest percentage of international revenue exposure, which Bespoke notes is “ironic given Trump’s ‘Make America Great Again’ platform.” The worst-performing stocks are those with the highest dividend yields (based on decile analysis of price performance versus dividend yield).
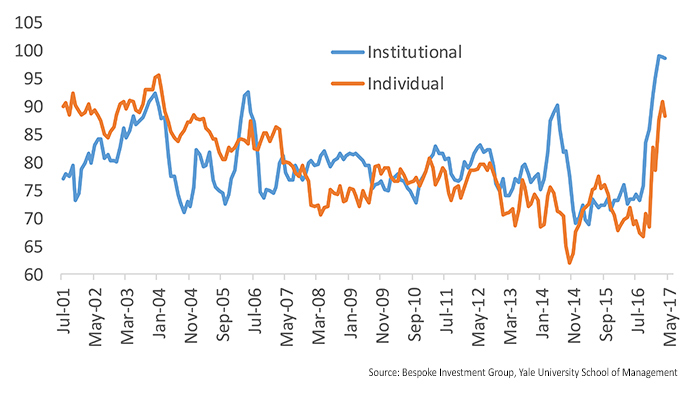
- “Confidence” readings regarding the equity markets remain at elevated levels. Bespoke cites an ongoing tracking study conducted by Yale University’s School of Management, where one key analytical finding “measures the percent of investors that think the stock market will be higher than it is now one year from now” among both retail and institutional investors.
FIGURE 4: YALE ‘ONE-YEAR CONFIDENCE’ READING (2001–PRESENT)
Bespoke also notes in its market scorecard how the recent rally past March highs reaffirmed the ongoing status of the current bull market, now standing at just over 8 years old. Says Bespoke: “At 2,984 calendar days, this is now the second-longest bull market on record for the S&P 500 going back to 1928. Remember, a bull market is a rally of 20%+ that was preceded by a 20%+ decline. Since 3/9/09, we’ve yet to see a drop of 20%+ from a high.”