
Market philosophy: Where active management begins
Market philosophy: Where active management begins

How do you get there from here? 10 analytical approaches to the investment decision.
Active management comes in different varieties—including traditional market timing, dynamic asset allocation, core and satellite strategies, absolute return, sector rotation, and as many variations on the theme as there are ways to build an investment portfolio. But, ultimately, every approach starts with a philosophy of how financial markets work.
How does the portfolio manager arrive at his or her market philosophy? Like most aspects of investing, there is no absolute right or wrong approach. Active asset managers have seen an explosion in computing power over the past 20 years, affording an unimagined level of sophistication in modelling, backtesting, algorithms, and data-driven portfolio management. But active management still must start with a “market philosophy”—and a variety of “timeless” analytical tools can be used to help managers in strategy development consistent with that philosophy.
Here is a look at 10 broad analytical approaches that underlie much of active management:
(1) Fundamental approaches have a forecasting aspect and look at valuation measures, earnings growth, dividend projections, market opportunities, and more to identify sectors, geographic markets, or individual securities that can be expected to increase in value, preferably faster than the market as a whole. A fundamental approach may also consider the economic or business cycle to assess which asset classes or sectors will benefit from current and upcoming market conditions. When active managers use fundamental analysis, it is typically blended with market-data-based tools.
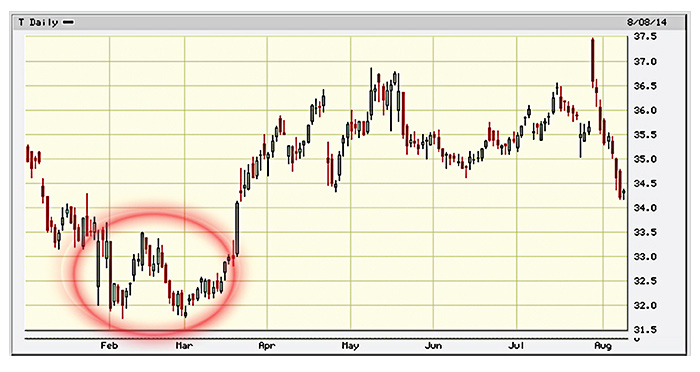
(2) Pattern recognition is among the oldest of the active investment approaches and includes charting techniques such as candlesticks, head-and-shoulders formations, multiple bottoms, and price support and resistance. Data analysis is used largely to identify patterns today, but there remains an art to successful pattern recognition. Financial markets don’t always play out the same way or in the same time frame. Nevertheless, there are investment managers who have been and are extremely successful with this approach (see Chart A).
Chart A: AT&T Double Bottom in February-March, 2014. Two prices testing the same level may indicate a stock or index has reached either a top or bottom.
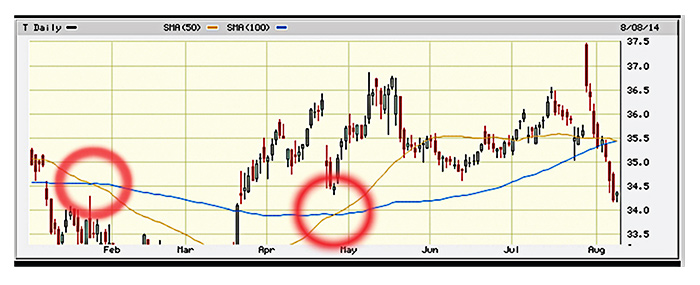
(3) Trend following uses tools, such as moving averages, to determine when a market or market segment is in an uptrend or downtrend to position assets accordingly. This approach tends to work best when the market is making a sustained directional move and falters in “trading range” markets. Buy and sell signals also frequently lag market tops and bottoms, making the approach vulnerable to whipsaws. The golden cross, when a short-term moving average crosses a long-term moving average, is a classic trend-following indicator (see Chart B).
Chart B: AT&T Golden Cross in April 2014, where the 50-day SMA crosses the 100-day SMA.
(4) Relative-strength investment approaches strive to target market leaders by comparing the percentage change in price for a sector or security over a set number of market days to other investment options. Short-, intermediate- and long-term rankings may be used. Leaders tend to have high relative-strength rankings before major price moves. Investments with failing relative strength indicate weakening prices and time to move on. This approach is very different than one that espouses buying “dips” when prices are falling.
(5) Momentum investing targets investments that are gaining in value faster than competing investments. Chicago money manager Richard Driehaus, widely considered the father of momentum investing, maintained “far more money is made buying high and selling at even higher prices.” Buying stocks simply because they have risen in price may seem simplistic, but numerous academic studies have shown that it can work very effectively. Momentum analysis is also used to identify whether a sector, index, asset class, or geographic market is in a buy or sell mode.
Active asset managers have seen an explosion in computing power over the past 20 years, affording an unimagined level of sophistication.
(6) Overextended/mean-reversion analysis strives to determine the difference between normal and “extreme” behavior, that is, when investors overreact to market information, creating a “bubble” effect. These strategies are based on mean reversion—the tendency of financial markets and investments to return to average values. Typically considered contrarian investment approaches, overextended strategies require taking positions that conflict with the current market mood or direction. They are vulnerable to being too early in entering or exiting market moves and tend to have their greatest effectiveness in trading range markets.
(7) Behavioral finance is a relatively new field that seeks to anticipate market direction by understanding why and how people make financial decisions. Crowd psychology and sentiment-tracking play a strong role in this approach. Behavioral-finance approaches tend to seek assets that are mispriced because of irrational tendencies such as following crowds or overreaction to market fluctuations.
(8) Seasonality is an approach to the market that looks not at what the market is doing but what day it is, or in the case of the presidential cycle, which year of the president’s four-year term it is. Hulbert Financial Digest maintained in 2003 that the market-timing system with the best 20-year record, gaining 13.5% annualized, was Norman Fosback’s Seasonality Trading System. A variety of seasonal analytical approaches can be employed, depending on the asset class.
(9) Cyclical models are based on the concept that any data series is made up of many repetitive waves of varying length and amplitudes acting simultaneously. Fourier analysis and Elliott wave theory are two examples. Elliott wave theory maintains that stock market trends unfold in five waves, three upward pointing, and minor waves that serve as intermediary corrections. Once a five-wave move is finished in one direction, the market makes a large-sized move in the opposite direction that corrects the entire prior sequence of five waves. Knowing where the market is in the cycle, tells the investor when to go long and then sell or to short a position.
Active investment management strategies may blend elements of many different analytical approaches in a single strategy.
(10) Divergence indicators encompass a broad range of market data from the ratio of stocks advancing compared to stocks declining, put call options, volatility, earnings projections, and more with the objective of looking for when these indicators diverge from their norms, given the market’s current action. When the indicator diverges from its typical pattern, it’s a flag to look for confirmation in other indicators.
Variations on the themes described above and unique investment systems abound in the financial industry, limited only by the variety of ways individuals view the financial markets. Active investment management strategies may blend elements of many different analytical approaches in a single strategy. There is also a growing emphasis toward moving away from a single all-in-one strategy to an approach, instead, of allocating among analytical approaches based on which individual or blended approaches are producing the best performance in current market conditions.
Keep in mind that these are just some of the basic tools used by active managers to effectuate their market philosophy. Because the investment field attracts some of the best and brightest analytical minds, new and different ways of looking at the financial markets are continually emerging—all with the essential mission of producing strategies with favorable risk-reward relationships.
The opinions expressed in this article are those of the author and do not necessarily represent the views of Proactive Advisor Magazine. These opinions are presented for educational purposes only.
 Linda Ferentchak is the president of Financial Communications Associates. Ms. Ferentchak has worked in financial industry communications since 1979 and has an extensive background in investment and money-management philosophies and strategies. She is a member of the Business Marketing Association and holds the APR accreditation from the Public Relations Society of America. Her work has received numerous awards, including the American Marketing Association’s Gold Peak award. activemanagersresource.com