

In musical terms, cadence is the rhythmic sequence of notes or chords that signals the momentary or complete end of a phrase or section, or of the whole composition. That analogy to the markets and their components, when transposed, can help identify different market rhythms and their transitions from one to another. I want to share a very simple tool for your toolbox that can help measure the macro pulse and early behavioral detection of any tradable item and in any time interval: the cadence tool.
This tool simply establishes “at least percentage” movements in price to create inflection points. Reviewing shorter price rhythms helps assess the health of a longer trend. The second element of the cadence tool is the length of time. By quantifying the peak-to-trough price decline and peak-to-trough time distance, the discipline of monitoring an established cadence and detecting an emerging cadence can bridge some gaps on what can be done in a money-management system to reduce volatility and drawdown.
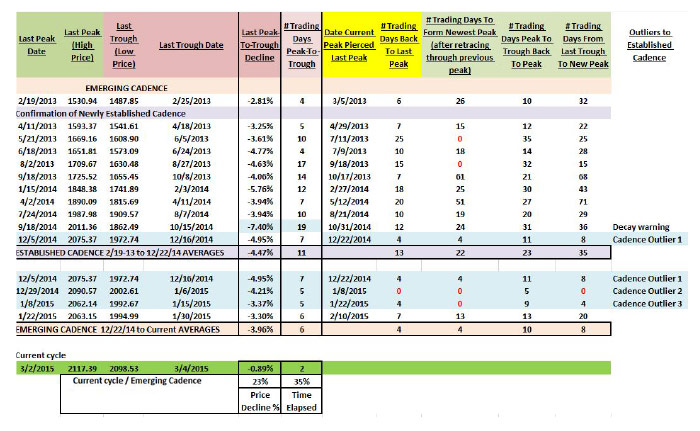
The real-time tracking methodology measures the price decline since the last closing price peak date while counting the trading days during that decline (see the following table). In this example, the S&P 500 decline must be 2% or worse from the peak price.
Source: Investment Portfolio Solutions
The end of the decline-tracking occurs when there is at least a 2% or greater increase from the closing price low. Once at least a 2% or greater bounce has occurred from the low, then the time-monitoring of price to see if it can pierce through the last peak is next. If the previous peak is pierced, time-monitoring continues until the new future peak has been attained. Once attained (there must be at least a 2% fall from the peak), the opposite occurs—the monitoring of decay.
Next, I run an average of the peak-to-trough price declines and the average number of days elapsed. This average starts from the beginning of the established cadence. There is latency, however. I use a two-outlier rule to label an emerging cadence that is strengthening while the established cadence is decaying. During this transition, allocations are changing to a more defensive posture. Once the established cadence has ceased and the emerging cadence becomes the established, then the outlier events are pulled into the new established cadence measurements.
In the table, you will notice a consistency of rather shallow and quick dips between Feb. 19, 2013, and Sept. 18, 2014, in the S&P 500. However, on Oct. 15, 2014, a decline of 7.40% occurred and created a price outlier. Also, the number of days elapsed was uncharacteristic to the previous peak-to-trough periods. This preceded the first big outlier during the period from Dec. 5 to Dec.16, 2014, when the Index experienced another decline, then was out of sync with the previous longer recovery periods. This outlier was followed by a confirmation outlier between Dec. 29, 2014, and Jan. 6, 2015, when the S&P 500 fell more than 4% and within five days increased at least 2% but could not pierce the last peak. Outlier 3 again supported outlier 1 and 2.
In order for a longer positive trend type of cadence to emerge, we must continue to have elongation of recovery on the bounces from the troughs producing higher highs, while having a succession of higher lows during the decay periods. Right now there is a new outlier to the possibly short-lived choppy cadence we saw in December 2014 through January 2015. We shall see.
The opinions expressed in this article are those of the author and do not necessarily represent the views of Proactive Advisor Magazine. These opinions are presented for educational purposes only.
 Ian Naismith is a partner and the index designer of Smooth Sailing Indexes Inc., which is a leader in tactical “risk-on/risk-off” index development. Mr. Naismith has been analyzing and trading the markets since the early 1990s. He is a member of the National Association of Active Investment Managers (NAAIM) and has also served as board member and president. www.smoothsailingindexes.com
Recent Posts: