


Perhaps the most important point to make regarding breadth as it relates to popular critiques of the current bull market is the distinction between market leadership and market breadth. Rarely a day has passed throughout the long bull advance without the utterance of the term “narrow leadership” and the grim implication of an imminently approaching major market top.
One of the principal problems with this line of thinking is that leadership is narrow by definition. For example, the all-star players on any sports team are typically going to score the most points, outperform, and lead. These standouts are assets to any organization. Likewise, the best stocks in a market of stocks are bound to attract the most robust demand from buyers and will have the tendency to outperform, sometimes dramatically.
Therefore, as has been the case for much of this bull market, the leadership of large, fast-growing companies in and of itself does not necessarily have negative broad-market implications. Rather, relative strength of the best stocks in the best industries and the strongest sectors is a natural by-product of investors’ pursuit of excess returns. In fact, as Lowry’s analysis of sectors, industry groups, and stocks demonstrates, identifying and overweighting these relative-strength areas can lead to exceptional portfolio (out)performance.
Conversely, were it the case—as it was toward the end of the 1990s bull market, where only these top stocks were performing—that would be a market breadth problem.
The key differentiating characteristic is that effectively only these large, favored companies were still advancing toward the end of that famous bull market. When this occurs, as evident in many market tops before it and since, the exceptional performance of this relatively small group of stocks obfuscates what is happening with the broad stock market.
Because the major market indexes are market-capitalization-weighted, or price-weighted in the case of the Dow Jones Industrial Average, index prices alone can at times be misleading. In such instances, the major market indexes continue to advance, but without many of their constituents. This is where the confusion may arise for some market participants. However, investors can identify when a stock market advance is becoming less consistent and narrower by monitoring accurate gauges of market breadth versus price indexes and other performance-based metrics. Fortunately, this narrowing in market participation usually occurs well before the arrival of a major market top and is manifested by divergences between these price indexes and breadth indicators.
Breadth is a measure of stock market participation, whereby, in a healthy bull market, the vast majority of all stocks are advancing. This generates the results observed headed into the most recent bull market high on September 20—positively-sloped price indexes and breadth indicators, with new highs in price gauges, continuously confirmed or led by new highs in a variety of breadth measures.
More specifically, Lowry’s Operating Companies Only (OCO) breadth indicators—Cumulative Advance-Decline Line, Net Points, and Net Volume Indexes—confirmed the September 20 market high.
As opposed to NYSE all-issues breadth data, which includes interest-sensitive preferred stocks and closed-end bond funds, the OCO data more accurately appraises the health of stocks, not bond proxies. As such, regardless of the fact that going into the recent all-time highs the most attractive stocks continued to outperform the broad market, the broad market was still generally advancing quite evenly (in breadth terms).
The following chart of Lowry’s OCO Breadth Indexes provides a granular illustration of this point and should serve to further emphasize the crucial distinction between market leadership and market breadth. So, the next time someone raises “concern” over the reality that a large, all-star stock has reached yet another new all-time high, ask them how many points per game LeBron James should be scoring instead and direct them to the more appropriate measures of internal market health to help assuage their fears. With the current correction in full swing, the market could certainly benefit from the re-emergence of sustained strength from those leaders.
FIGURE 1: LOWRY RESEARCH’S OCO BREADTH INDEXES THROUGH SEPTEMBER “TOP”
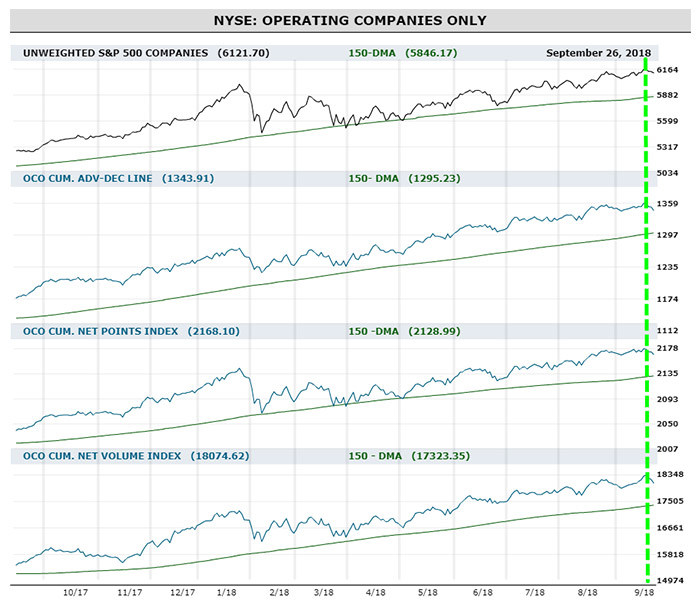
Source: Lowry Research, market data.
Author’s note: The cumulative advance-decline line is the cumulative daily total of net advancing issues, less declining issues for Lowry’s NYSE Operating Companies Only Index. The cumulative net points gained index is a measurement of intensity and is often a coincident indicator. This index tracks the cumulative daily total of net (index) points gained, minus index points lost. The cumulative net upside volume index is a measurement of activity and provides valuable insight into the underlying strength in a given market. This index measures the difference between upside volume and downside volume, netting the result and adding it to the running total of all prior days.
The opinions expressed in this article are those of the author and do not necessarily represent the views of Proactive Advisor Magazine. These opinions are presented for educational purposes only.
 Vincent Randazzo, CMT, is a senior market analyst at Lowry Research with more than 15 years of experience in professional equity market research, technical analysis, and market intelligence. Before joining Lowry, Mr. Randazzo was chief market analyst at NASDAQ. He was also director of research at ICAP and a research salesperson at Morgan Stanley and UBS. He has been a Chartered Market Technician (CMT) since 2008. For more information on Lowry Research, please visit lowryresearch.com.
Recent Posts: