

While the talking heads on your favorite financial news network are likely touting the new highs (I guess—I gave up watching that stuff years ago), other forces have silently been at work for years undermining the real rate of return. It is my opinion that the goofing of the CPI calculation by the Bureau of Labor Statistics over the past few decades has reduced major payout stress of the Social Security annual Cost of Living Adjustment (COLA) increases for existing and future baby boomers. This is especially provocative after the 1990 CPI adjustments.
The notion that CPI is a true representation of price change over time for a “standard of living” lost its validity long ago. Without explaining in detail what has formed my opinion, you can find plenty of data and analysis of the CPI manipulations via construction and the form of calculations on various sites.
So, let’s break it down in the numbers. This is a promise: The following premise and/or calculations can be scrutinized—there are so many factors that could be argued for measuring the “true high”—but, conceptually, I hope this sheds some light as to how “off” the “new highs” really are. The S&P 500 close on May 7, 2015, was a nice round number of 2,088.00, and the U.S. Dollar Index (DXY) close was 94.64.
Now, if I were a lucky person and bought the S&P 500 at the close on March 24, 2000, which was its “all time high” at that point, I would have bought one unit at 1,527.57 with a DXY value at close of 104.56. Then I held to now. Needless to say, the next 14 years or so would’ve been “a long, strange trip.”
ILLUSION OF THE CURRENT “MARKET HIGHS”
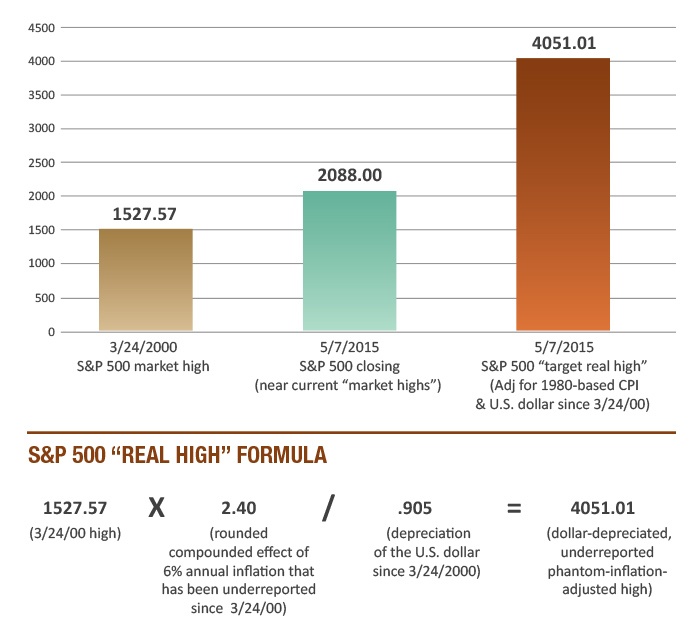
Source: Ian Naismith, Kensington Analytics LLC
So, not adjusting for dividends (because the index calculations are not), you would have had a 36.7% increase in your S&P unit, or a little more than 2% annual return. Pretty good … not. Here is where the CPI manipulation comes in. Isn’t the main goal of investing in equities and equity indexes like the S&P 500 to outpace inflation? How has the net return of the S&P 500 dividend stream, less fees/expenses, been in the last 15 years? Pretty thin.
Between the market high in 2000 and today, the BLS-posted official CPI is an estimated 6%-7% lower than if the CPI had been calculated with 1980-based CPI methodology. That is a huge amount of unaccounted-for additional inflation. The S&P 500 unit growth now looks pretty paltry, right? Now, let’s pour on the U.S. dollar effect. The basket has not changed since 1999, so the 2000 high example is a currency apples-to-apples time comparison. Although the U.S. dollar has rallied for the past year, it is still -9.5% off of May 24, 2000. Low equity returns, depreciating dollar—don’t get too bummed out!
Finally, my interpretation of what the S&P 500 “real high” should be is illustrated in the previous figure. This calculation requires a perfect world: a tax-free, fee-free S&P 500 total return of 6.71% per year to equal the combined effects of the depreciating dollar and unreported phantom inflation since March 24, 2000. So, our “high” of 2,088 is actually only 51% of where the real “high” should be.
Look at the bright side: On July 1, 2014, the real high was 4,578.53 when the S&P 500 was 1,614.96, so we are gaining ground.
The opinions expressed in this article are those of the author and do not necessarily represent the views of Proactive Advisor Magazine. These opinions are presented for educational purposes only.
 Ian Naismith is a partner and the index designer of Smooth Sailing Indexes Inc., which is a leader in tactical “risk-on/risk-off” index development. Mr. Naismith has been analyzing and trading the markets since the early 1990s. He is a member of the National Association of Active Investment Managers (NAAIM) and has also served as board member and president. www.smoothsailingindexes.com
Recent Posts: