

Magic bus
It is somewhat easy to understand the market run of 2009-2012: A historic decline created a coiled spring helped by bank bailouts, QEs, QEs with a twist, etc. However, many advisors and industry experts I know have a more nebulous time trying to explain the market behavior of 2013-present. Many agree that this bull is long-in-the-tooth. Many can see the bus that is going to hit the markets clearly in front of them; but then, the bus doesn’t hit the markets. It’s kind of like the opposite of looking in the side mirrors of your car—“objects appear closer than they are.” So, here we are in the age of the “magic bus”: A market that continues to defy gravity being propped up by many forces—traditional, unconventional, and, some would flat out argue, manipulative. Dear old friends, random people at the neighborhood bar, and many advisors are finally anesthetized to believing this is the Zen zone of the market and that nothing wrong could possibly happen. Buying equities continues to be the “in” thing and everyone is an expert. Until … the tragic bus.
Tragic bus
Yep, these markets travel on a steep declining road on bald tires in icy conditions. They generally will at some point have chunks of advisors in their grills and can produce enough fear in months to wipe out the elation of the previous several years.
62-day moving average of % decline from all-time highs
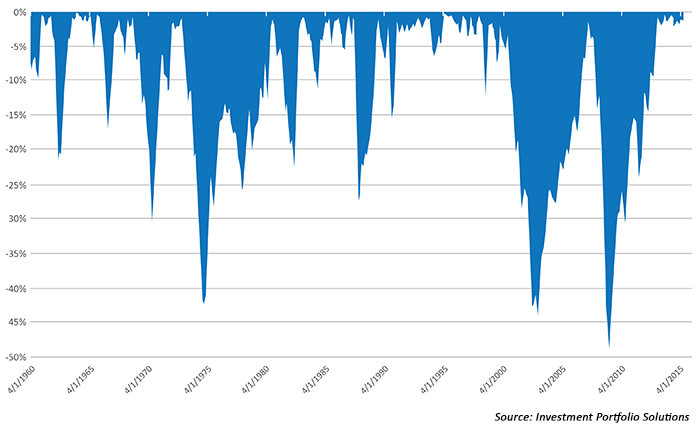
Recent price compression
I have gone back 55 years with daily price data to graphically express the 62-day moving average (roughly a trading quarter) of the percent decline from the last all-time high. You will find that we are at historic lows. The last time we were compressed to the new highs was a period between 1963 and 1965. I had to use a moving average to combine data points because simply using daily data would not be perceived on the chart. Zany, eh?
I also went back 55 years with daily price data to graphically express the days elapsed since the last all-time high. This chart really shows the compression of time from being rewarded with a new high. Again, the easy-money stress of time is more docile than the best times of 1995 through the market high of 2000.
So, what can you do with this information? On one hand, it can be argued that graphically we had two gigantic peak-to-trough price declines in a relatively short time period in 2000-2002 and 2007-2009 and we are “due” for an extended money period. On the other hand, it can be argued that this “magic bus” cannot roll forever and that the “tragic bus” is overdue for a visit. At this point, I’m practicing a balance of both philosophies.
The opinions expressed in this article are those of the author and do not necessarily represent the views of Proactive Advisor Magazine. These opinions are presented for educational purposes only.
 Ian Naismith is a partner and the index designer of Smooth Sailing Indexes Inc., which is a leader in tactical “risk-on/risk-off” index development. Mr. Naismith has been analyzing and trading the markets since the early 1990s. He is a member of the National Association of Active Investment Managers (NAAIM) and has also served as board member and president. www.smoothsailingindexes.com