

According to a recent Bloomberg radio segment, “60% of bond ETFs have a negative 12-month performance,” due to the slowly rising interest-rate environment.
ThinkAdvisor wrote last week,
“Bond investors are running from anything that smells of interest-rate risk. Investors pulled billions of dollars from exchange-traded funds that track longer duration fixed-income plays, as Treasury yields resumed their upward march. In fact, the top four outflows for U.S.-listed ETFs on Tuesday were all fixed-income related, as investors also yanked cash from funds stuffed with junk bonds, according to Christian Fromhertz, chief executive officer of Tribeca Trade Group.
“The yield on benchmark 10-year bonds ticked up as high as 3.24% Wednesday, after dripping lower Tuesday in the wake of Monday’s holiday. Previously, investors had gotten used to ignoring bump ups in rates, since every time they hit 3 percent, they came back down,’ said Bloomberg Intelligence ETF analyst Eric Balchunas. ‘But this one has broken through, so investors are nervous. This is a sign that investors do not think that rising rates are crying wolf,’ Balchunas said. ‘There’s fewer safe spaces where bond ETFs are not negative on the year, and that’s why you’re seeing more extreme flows. Rising rates have shaken things up for real this time.’”
One of the major bond ETFs, which acts de facto as a benchmark for many bond investors, is the iShares Core U.S. Aggregate Bond ETF, ticker AGG. AGG, says ThinkAdvisor, suffered its “biggest single outflow in the fund’s 15-year history” last week as investors pulled $2 billion on Tuesday alone.
FIGURE 1: 3-YEAR PRICE TREND FOR BOND ETF AGG
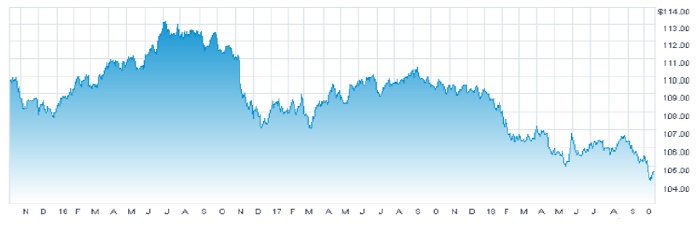
Source: Nasdaq.com, data as of 10.15.18
MarketWatch reported last week on the bond index that AGG strives to track, writing,
“The Bloomberg Barclays U.S. Aggregate Bond Index, linked to trillions of dollars of fixed-income, is on track to post its second-worst showing in history.
“The index is one of the most widely used barometers for bond-fund managers and is associated with more than $20 trillion of assets. Its poor performance underscores how fixed-income markets have struggled amid a strengthening U.S. economic backdrop, which has prompted the Federal Reserve to continue to raise rates and consequently driven bond prices lower and yields to multiyear highs.
“As of Thursday, the index year to date was down around 2.5% on a total return basis, which takes into account both the value of bonds held in the basket and the yields derived from those assets. It wouldn’t take much for the index to log its worst yearly performance. The weakest returns came in 1994 when the index slipped around 2.9%.”
They also note that AGG is “down around 4.5% this year,” but that “doesn’t reflect total returns.”
Charlie Bilello of Pension Partners constructed the illustration of the relationship between the U.S. 10-year Treasury yield and the 2018 performance of AGG seen in Figure 2, as well as Table 1, which shows down years for the Barclays U.S. Aggregate Bond Index. He wrote regarding the potential for further annualized total return losses on funds and ETFs tracking the Index, “-3% would be the worst year ever (data back to 1976). What bonds lose in their worst year stocks can lose in a day.”
FIGURE 2: 10-YEAR U.S. TREASURY YIELD VS. AGG 2018 TOTAL RETURN
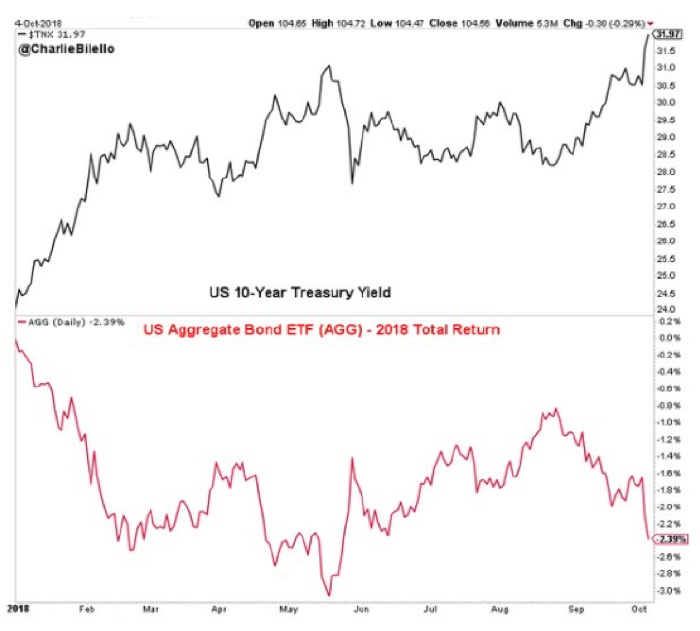
TABLE 1: BARCLAYS AGGREGATE U.S. BOND INDEX—DOWN YEARS (1976–2017)
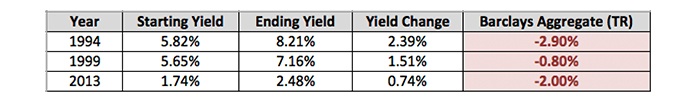
Source: Charlie Bilello (@charliebilello), data as of 10.4.18