
An equal-allocated neutral strategy to consider during September and October.
In the event the financial/economic news or geopolitical/domestic unrest finally starts affecting the equity markets, here is a boring strategy for weathering the storm—if you want to be invested and are not opposed to using single-beta inverse products. Boring is not a very compelling word, but being caught in a storm is an even worse scenario.
From a historical perspective, the months of September and October in the years 2000–2016 have yielded a whopping 1.39% cumulative return for the S&P 500 and a more respectable 20.46% return for the NASDAQ 100.
However, the Russell 2000 has a cumulative return of -9.63%, and the S&P MidCap 400 has a -11.55% return. That’s right, negative returns—and this includes dividends. I researched market behavior and seasonal ETF patterns in the weeks leading into September of each year. I found the deterioration was happening in small-cap and mid-cap stocks more profoundly than large-cap stocks in those years where a “paired trade” was the most fruitful. The paired trade I speak of is being long SPY and QQQ, while inversing 1X (no leverage) using the short ETFs MYY and RWM. If there is little or no deterioration in all of the major indexes during August, then the trade pairings were lackluster.
However, right now (the third week of August 2017), from a trend perspective, there is more deterioration in small caps and mid caps and little in large caps. Bingo. Whether you’re using moving averages, time-series forecasts, RSI, MACD—whatever—there is strong confirmation that small caps and mid caps are getting the flu, and large caps don’t even have a runny nose.
Also, breadth is faltering across the board, but most noticeably with the small and mid caps. As of this writing, 64.5% of the NASDAQ 100 issues are above their 200-day moving average, while the S&P 500 is at 62.1%. However, only 41.1% of the Russell 2000 issues are above their 200-day moving average, while the S&P 400 is at 43.7%. The trajectory of breadth deterioration from recent breadth percentage highs is soundly leaning, again, toward small and mid caps.
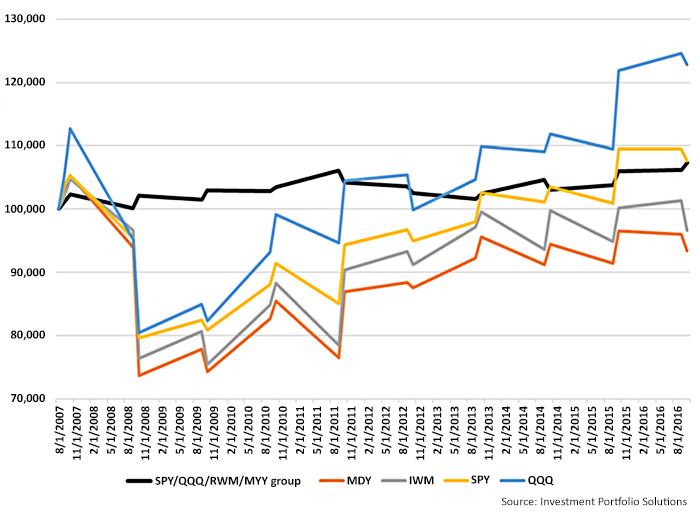
Here are the results if one was invested only in the months of September and October each year since 2007. SPY is +7.59% cumulatively. QQQ is +22.77%. MDY is -6.59%. IWM is -3.37%. And the max drawdowns range from -24.4% for the S&P 500 to -30% for the S&P 400.
Remember, the strategy proposed is strictly designed to protect capital if you believe we are a little toppy going into September. Please note, this strategy does not work well historically beyond the end of October.
Here are results of equal weighting SPY, QQQ, MYY, and RWM if you were to implement for only the months of September and October since 2007: A cumulative return of 7.4% with a maximum drawdown of -4.2%. So, in short, you’d receive the same return as the buy-and-hold S&P 500 but cut 20% of the drawdown and 80% of the volatility. It has produced positive returns 70% of the time with an average of +1.31%. During the negative return periods, the average is -0.62%. The worst result is -1.57%.
SEPT./OCT. INVESTMENT RESULTS: MAJOR INDEXES VS. LONG/SHORT PAIRED STRATEGY

The opinions expressed in this article are those of the author and do not necessarily represent the views of Proactive Advisor Magazine. These opinions are presented for educational purposes only.
 Ian Naismith is a partner and the index designer of Smooth Sailing Indexes Inc., which is a leader in tactical “risk-on/risk-off” index development. Mr. Naismith has been analyzing and trading the markets since the early 1990s. He is a member of the National Association of Active Investment Managers (NAAIM) and has also served as board member and president. www.smoothsailingindexes.com
