

The fourth quarter and, for that matter, virtually all of 2017, has been a “perfect season” so far for the U.S. equity markets: low volatility, continuing record highs for major indexes, and extremely shallow pullbacks on the rare occasions they have occurred.
Last week saw the volatility index (VIX) set an all-time intraday record low, reaching 8.56 before closing the week down 15.4% from the prior week. The S&P 500 and NASDAQ Composite touched record highs on Friday, and the Dow Jones was not far off one.
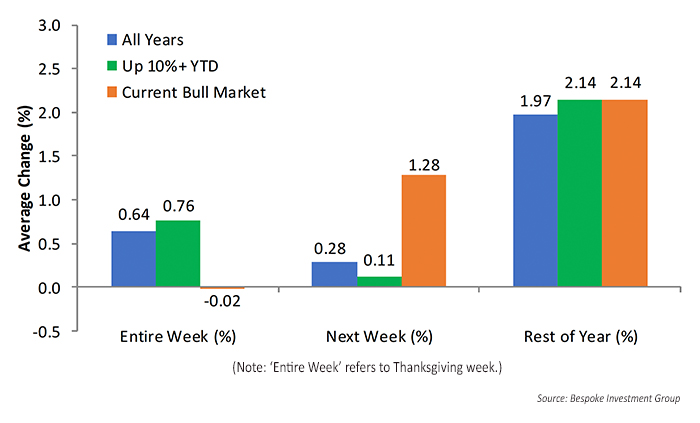
Will the market be able to continue its win streak into the end of the year, taking advantage of the traditional Santa Claus rally? According to Bespoke Investment Group, the historical probabilities favor that outcome. As Figure 1 shows, the post-Thanksgiving period has averaged close to a 2% gain over the past 70 or so years, and slightly above that in this bull market and years showing a 10%-plus gain through Thanksgiving.
Figure 1: PRE- AND POST-THANKSGIVING S&P PERFORMANCE (1945–2016)
Speaking of market volatility, the financial press continues to examine the issue of the current run of extremely low volatility (ELV). Bears argue that a lengthy period of volatility below historical norms equates to a dangerous complacency, setting the market up for an eventual dramatic fall. Bulls counter that as long as the VIX remains below the 15–20 range, investors can continue to ride the rising equity trend with relatively little fear.
It is impossible to say who is right, but there is no denying that it has been a remarkable period of market calm. Investing.com recently wrote,
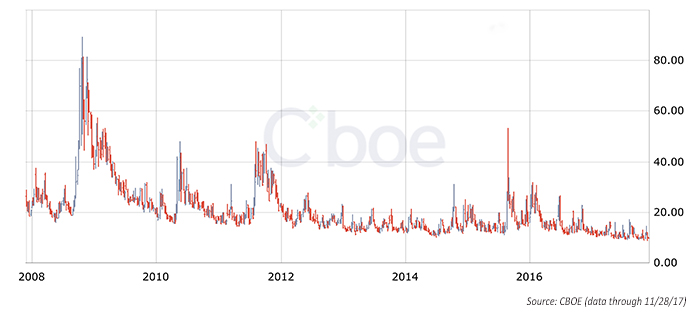
“The S&P 500 last completed a drawdown of 5% or more on November 4, 2016. … The last drawdown of 5% or more before that occurred around Brexit when the vote accelerated a near 3-week period of weakness. … Since these drawdowns, the biggest drawdown for the index was a 3% loss that ended six weeks of weakness on April 13, 2017. … The current period of ELV has lasted a record 151 trading days through November 24, 2017.”
FIGURE 2: CBOE VOLATILITY INDEX (VIX) (PAST 10 YEARS)
Interestingly, even the Fed has taken note of volatility—or lack thereof—in the markets. Barron’s points out that the latest FOMC minutes state,
“In light of elevated asset valuations and low financial market volatility, several participants expressed concerns about a potential buildup of financial imbalances. They worried that a sharp reversal in asset prices could have damaging effects on the economy.”
Barron’s notes that this might put the Fed in a bind as it considers interest rate policy for 2018, saying, “Now it has to weigh rising inflation pressures … against the risk posed by high, and arguably, inflated asset prices.”
According to another Barron’s article, a prominent analyst at Strategas Research Partners says years of low volatility have led to wider “return outcomes” the very next year. Chris Verrone of Strategas writes, “While we have very little appetite to bet against the current trend in stocks, history suggests we should expect some type of correction price action in 2018.”