

Yep—there is a whole lot of money slushing around right now. When the overnight shortage of money happened on Sept. 16, 2019, it forced the Fed to pump lots of cash into the plumbing of the capital markets.
After injecting well over $100 billion in a few days, it was reported the Fed would continue to ease the overnight stress by extending liquidity to Oct. 4. Then on Oct. 4, the Fed announced it would extend liquidity until Nov. 4. As of this writing, on Nov. 12, the last reported date of Treasury securities purchased by the Federal Reserve in the temporary open market operations was on Friday, Nov. 8.
And the liquidity fix is still continuing—well beyond the original estimates both in time and in dollars.
Blame is being pointed in different directions. I’ve seen reports blaming Saudi Arabia, Russia, large U.S. banks, and so on, for the mini-crisis on Sept. 16. We know that the decision-makers have been doing policy experiments since the market turmoil of 2008–2009, but here is my concern: Did Fed officials wrongly believe the banking system was hunky-dory while, in reality, it was experiencing a systemic shortage of money?
Further, are the extensions of “liquidity pumping” shedding light on a miscalculation of the overnight system’s fragility? To be clear, this is all beyond my expertise, but according to the St. Louis Fed website, during the 39 business days from Sept. 17 through Nov. 8, there were more than $1.93 trillion temporary open-market purchases of securities.
The 39-day moving average is almost $50 billion per day. To put things in perspective, there was a giant increase of purchases right after Sept. 11, 2001. Between Sept. 12 and Sept. 19 of 2001, there were six days totaling $311 billion. Then the purchase amounts reverted to normal.
What is really up here in 2019? Many conflicting opinions have been reported. I choose to look at the numbers.
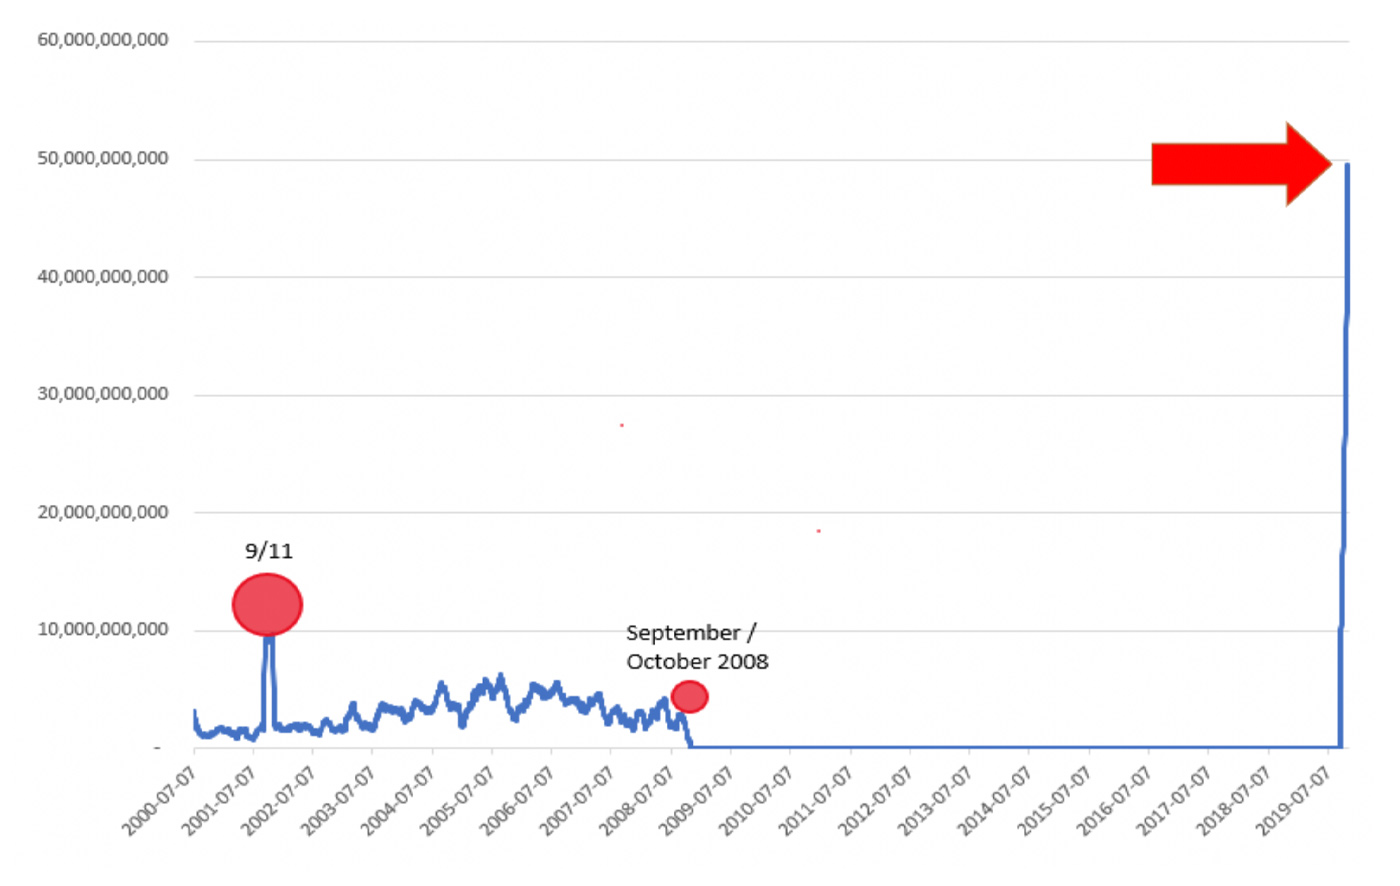
Note: Overnight repurchase agreements are Treasury securities purchased by the Federal Reserve in the temporary open market operations.
Source: The Federal Reserve Bank of St. Louis (FRED), Federal Reserve Bank of New York
Also, the Fed has started bond-buying programs at $60 billion per month that are being compared to QE, QE2, and QE3. Some believe that this is not quantitative easing because the motive is to fix significant problems in the capital markets rather than trying to prop up a sluggish economy as in the first three QEs. Hmm, I don’t know which is worse. And since we are told not to call it QE4, can we call it “magnified relieving” or MR?
My concern is—and has been—that a bubble may be forming. We’ve seen how bubbles formed in the past. Generally, they were concentrated in specific sectors or themes. Historically, financial bubbles are “normal” just like market corrections used to be normal. A whole lot of financial engineering has occurred since the 2000–2002 bear market, and especially after the 2008–2009 bear. This has thrust us into a world of many bubbles. One could argue that it would be easy to name a dozen concurrent bubbles—federal debt, student loans, health care per capita, etc.
None of us know how long the current bull will run, but I fear that the excessive debt will create a scenario similar (or worse) to what we experienced in 2008 if multiple bubbles begin losing air or popping simultaneously.
It makes sense to do research on the track records of managers who navigated that 2008–2009 period and other bear markets with grace and be prepared to act when you feel the “bear bell” has finally rung.
Editor’s note: Here is an interesting commentary on this issue from the Federal Reserve Bank of St. Louis (FRED):
“The June 13, 2019, FRED Blog post showed how, in a world of ample reserves, the FOMC sets a target range for the federal funds rate (FFR) and uses interest on excess reserves (IOER) and the overnight reverse repurchase agreement facility (ON RRP) to keep the FFR rate in the target range.
“Since July 2019, the FOMC has lowered the target range for the FFR twice, effectively injecting liquidity into the banking system. And, at the September 17-18 FOMC meeting, the committee announced a 0.25% cut in the target rate, with an accompanying cut in the interest rate on excess reserves. But ahead of that meeting, the effective FFR spiked, exceeding the upper limit of the target range. So, an additional monetary policy tool was put into action.
“On September 17, 2019, the Federal Reserve Bank of New York began conducting temporary open market operations through overnight repurchase agreements: That is, it purchased Treasury securities held by banks. The FRED graph [shown here] shows these recent operations. By default, FRED graphs with daily data show the past 5 years, so these temporary operations look like an ant parade along the x axis that lead to the recent interventions high in the stratosphere of the upper right corner. However, if you expand the graph to show the available data (by adjusting the date slider below the graph), you see these operations occurred almost every day up to 2008. We show this bigger picture in the graph [shown here].”
 Ian Naismith is a partner and the index designer of Smooth Sailing Indexes Inc., which is a leader in tactical “risk-on/risk-off” index development. Mr. Naismith has been analyzing and trading the markets since the early 1990s. He is a member of the National Association of Active Investment Managers (NAAIM) and has also served as board member and president. www.smoothsailingindexes.com