

The Conference Board Leading Economic Index (LEI) for the U.S. increased 0.4% in August to 111.2. This came after a 0.7% increase in July and 0.5% increase in June, continuing the Index’s impressive run over the past two years.
The Conference Board said in its press release on September 20, 2018,
“‘The leading economic index is now well above its previous peak (March 2006, 102.4). The leading indicators are consistent with a solid growth scenario in the second half of 2018 and at this stage of a maturing business cycle in the US, it doesn’t get much better than this,” said Ataman Ozyildirim, Director of Business Cycles and Growth Research at The Conference Board. ‘The US LEI’s growth trend has moderated since the start of the year. Industrial companies that are more sensitive to the business cycle should be on the lookout for a possible moderation in economic growth in 2019. The strengths among the LEI’s components were very widespread, further supporting an outlook of above 3.0 percent growth for the remainder of 2018.’”
FIGURE 1: THE CONFERENCE BOARD LEADING ECONOMIC INDEX
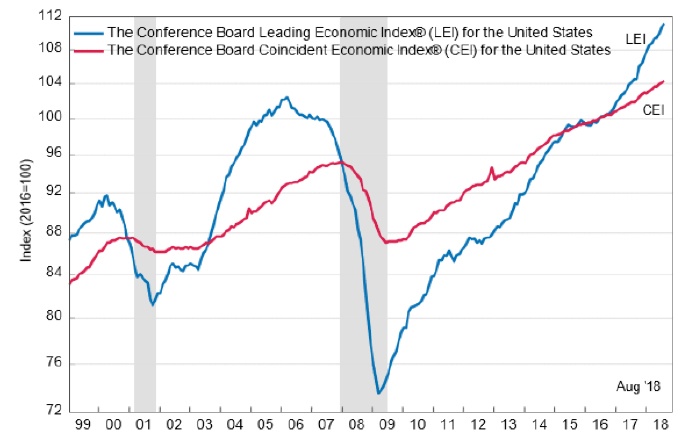
Note: Shaded areas represent recessions.
Source: The Conference Board.
Although some recent economic indicators and reports have been mixed in terms of performance versus consensus outlook, the U.S. economic picture remains solid. The second quarter GDP revisions released on September 29 beat expectations, with Q2 GDP now estimated at 4.2%. The Atlanta Fed currently has a forecast of 4.1% for Q3 GDP, although consensus estimates are in the 3.0% to 3.5% range.
However, several analysts have noted that global growth appears to be exhibiting some signs of a slowdown. Fidelity Investments wrote recently, “Global activity remains solid, but the pace of growth has deteriorated. Manufacturing activity (PMIs) in 87% of the world’s largest economies are in expansionary territory; however, only 10% are improving on a 6-month basis.”
Bespoke Investment Group said last week, “While the global trade volume backdrop saw some bounce-back in July, global industrial output growth continues to slow. … The 3m/3m annualized pace of growth for industrial production is the weakest since December of 2016.”
FIGURE 2: GLOBAL INDUSTRIAL PRODUCTION GROWTH
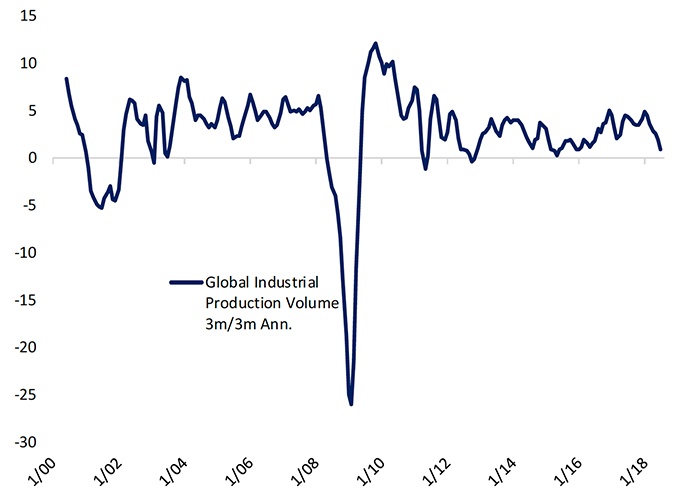
Source: Bespoke Investment Group
FIGURE 3: INDUSTRIAL PRODUCTION GROWTH ANNUALIZED BY REGION
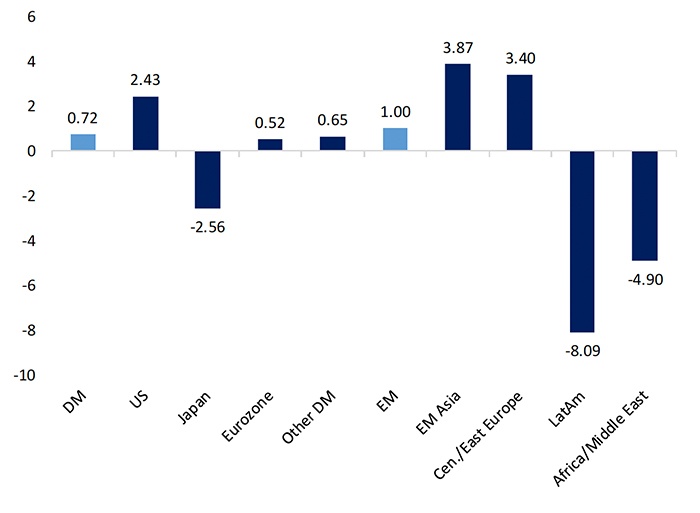
Note: DM = Developed Markets; EM = Emerging Markets
Source: Bespoke Investment Group
The opinions expressed in this article are those of the author and do not necessarily represent the views of Proactive Advisor Magazine. These opinions are presented for educational purposes only.