According to most analysts, the 2016 Q2 earnings season—though reflecting a decline versus year-ago results—has turned out to be somewhat better than expected.
With 95% of S&P 500 companies reporting through last week, FactSet says 71% had earnings above the mean estimate and 54% reported sales above estimate. However, the overall blended earnings decline for the S&P 500 so far is -3.2%. Q2 2016 would “mark the first time the index has recorded five consecutive quarters of year-over-year declines in earnings since Q3 2008 through Q3 2009.”
FactSet says that for Q3 2016, 72 S&P 500 companies have issued negative earnings (EPS) guidance and 30 S&P 500 companies have issued positive EPS guidance. The forward 12-month P/E ratio for the S&P 500 is 17.1. This P/E ratio is based on last Thursday’s closing price (2187.02) and forward 12-month EPS estimate ($128.46). As Figure 1 shows, EPS growth for the S&P 500 has largely flattened out since 2014, while the market price performance remains on an upward trajectory.

The Financial Times notes that while “earnings results have set a somewhat lackluster tone for the remainder of the year,” investors are not appearing to exhibit too much concern:
“After five consecutive quarters of earnings declines, investors have patiently awaited a recovery in profitability by the largest U.S. companies. While they will probably have to hold out until the end of the year—Wall Street analysts have penciled in another decline for the third quarter, albeit a shallower drop than in the first half of 2016—investors have already started a rotation into riskier and more cyclically geared sectors of the economy.”
- “Brexit”: “Despite little immediate effect on multinational businesses, (it) has sparked uncertainty across management suites.”
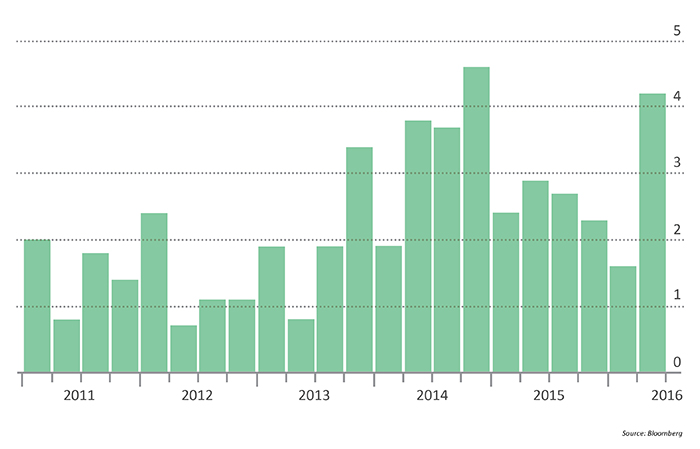
- The U.S. consumer: “The driving force” behind the U.S. economy’s recent performance, both good and bad. Figure 2 shows the recent upbeat data for personal consumption, despite a Q2 GDP report that was extremely disappointing with a 1.2% overall growth rate.
- Oil prices: Energy companies have been a severe drag on overall S&P 500 earnings performance, and though the outlook is improving with a better price trend for crude oil, “revenues in the third quarter are expected to fall another 11 per cent from a year earlier.”
- Wage pressures: Though growth in U.S. workers’ salaries has been extremely slow during this economic recovery, “average hourly earnings increased at the fastest pace in July since December, matching the highest level since the global financial crisis.”
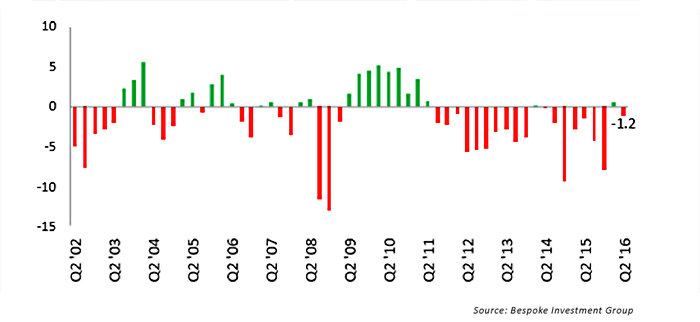
Bespoke Investment Group summed up the Q2 earnings season and the outlook for Q3:
“After turning slightly positive for one quarter last season, the guidance spread (percentage of companies raising guidance minus lowering guidance) flipped back negative this earnings season. … Negative guidance spreads are nothing new in this market environment (as seen in Figure 4). The outlier is the rare season where we see more companies raised guidance than lower guidance. Only when the guidance spread is extremely negative is it cause for concern, and that was far from the case this season.”