
Is the commodities cycle finally ready to turn?
Is the commodities cycle finally ready to turn?

After a false start in 2018, will it be “ready, set, go” for commodities in 2019? Several individual commodities are trading at historically low volatility levels and within tight price bands, suggesting that reversion to the mean is not too far away.
When looking at the commodity markets, one can’t help but wonder when commodities as an asset class might again be at the forefront when compared to U.S. stocks and bonds.
As we now are well into 2019, there are a number of possible contributing factors keeping commodities in check. This includes the global growth slowdown, no resolution regarding the trade war between the U.S. and China, unprecedented low volatility (both in equities and commodities), and virtually no price inflation to speak of.
However, the recent shift by the Fed to a more dovish stance could be the impetus to move certain commodities higher, especially those more closely tied to a weaker U.S. dollar.
Commodities continue to trade near 50-year lows when compared to the U.S. equity market. The price ratio of the S&P GSCI, a highly regarded commodities index, relative to the S&P 500 certainly illustrates that point, as it hovers around the bottom end of its historic range.
One can make the case that an investment in commodities may be timely if considering both their current valuation and price relative to other asset classes.
Right now, a number of commodities are trading at historically low volatility levels and tight price bands. Although history may not hold true in this case, what tends to happen when we come off these periods of low volatility is a breakout to the upside. The Agricultural and Metal sectors, in particular, fall into this category and appear like a coiled spring ready to move higher.
FIGURE 1: GSCI/S&P 500 RATIO—EQUITIES EXPENSIVE, COMMODITIES CHEAP?
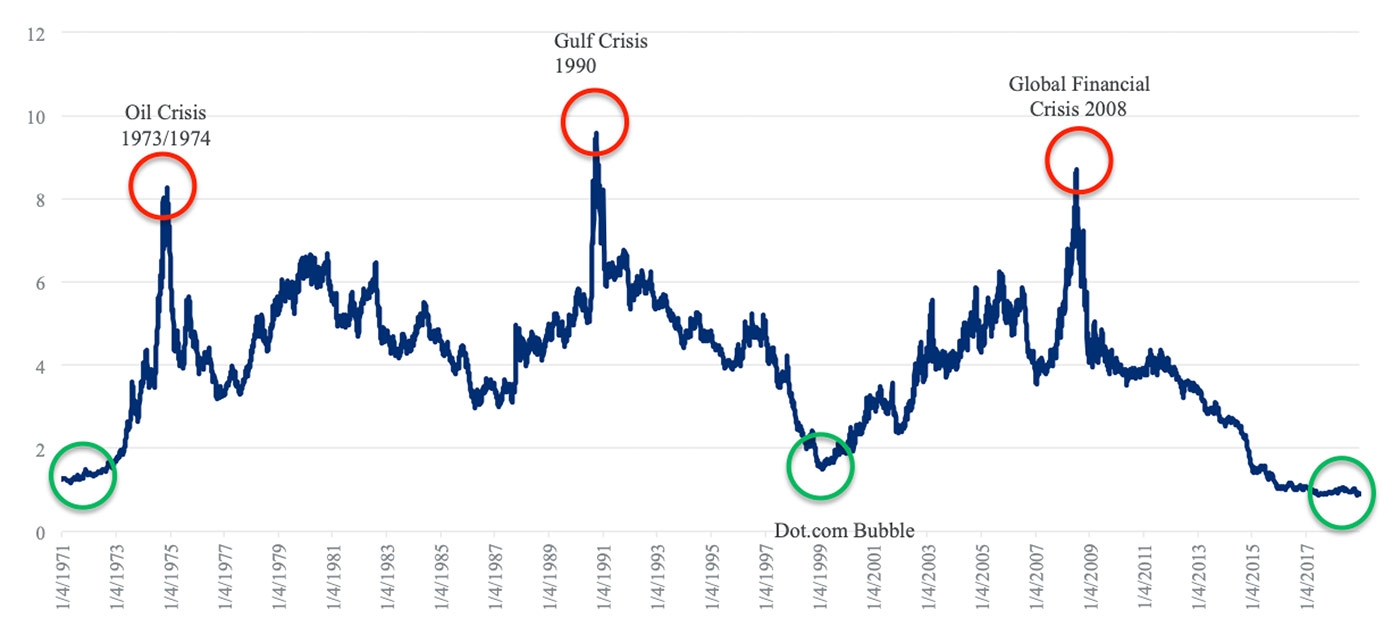
Note: In relation to the S&P 500 Index, the GSCI commodity index is currently trading at the lowest level in 50 years. The ratio sits significantly below the long-term median of 4.1. The performance data quoted represents past performance.
Source: Dr. Torsten Dennin, Incrementum AG, updated by Direxion.
When looking at the following Callan chart that includes alternative asset classes, one can see the underperformance of commodities both on an absolute as well as relative basis over the last 10 years. The next 10 years may not tell the same story if a reversion to the mean occurs.
TABLE 1: CALLAN CHART OF RELATIVE ASSET-CLASS PERFORMANCE (2009–2018)
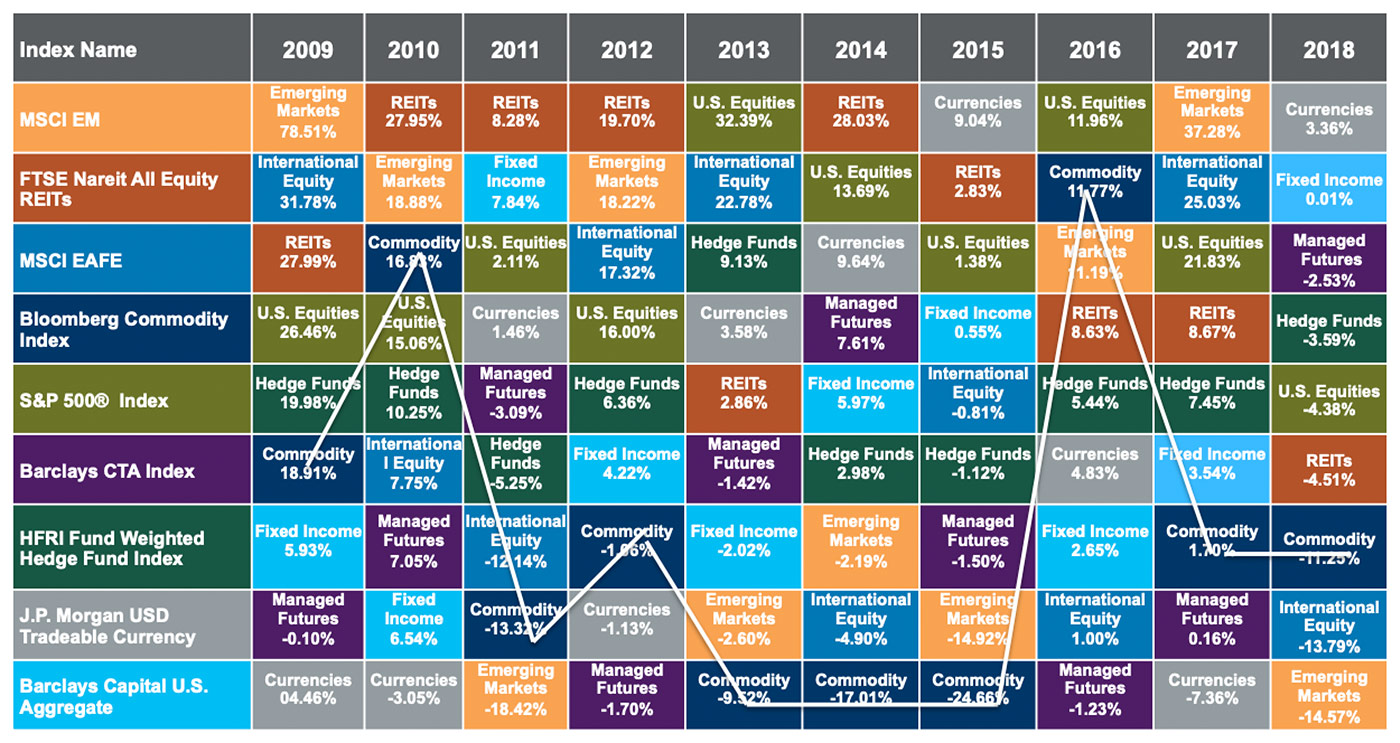
Note: Index returns are historical and are not representative of any fund performance. Total returns of the Index include reinvested dividends. One cannot invest directly in an index.
Source: Bloomberg. Date range: 1/1/2009–12/31/2018
The recent decision by the Fed not to raise rates in 2019 might be the signal that the U.S. dollar has hit a ceiling. As the following chart shows, there tends to be an inverse relationship between commodity prices and the U.S. dollar. A weakening U.S. dollar tends to be one of the drivers for higher commodity prices, particularly for the Metals sector, which tends to be the most sensitive commodity sector to the direction of the U.S. dollar.
FIGURE 2: REVERSING TRENDS? STRONG BUCK, WEAK COMMODITIES
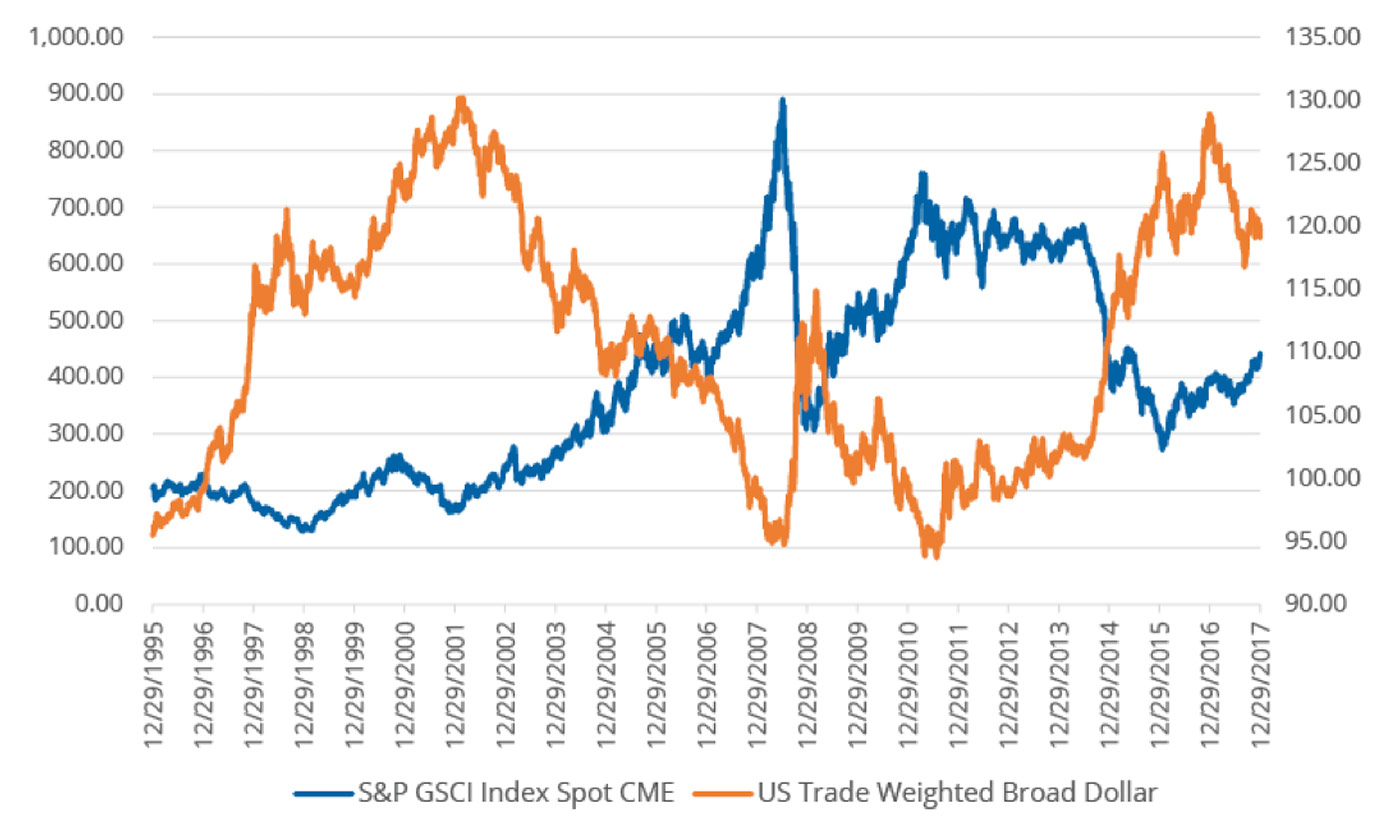
Source: Bloomberg. Date range: 12/29/1995–12/31/2018
FIGURE 3: GLOBAL DEMAND AND SUPPLY DYNAMICS FOR COMMODITIES
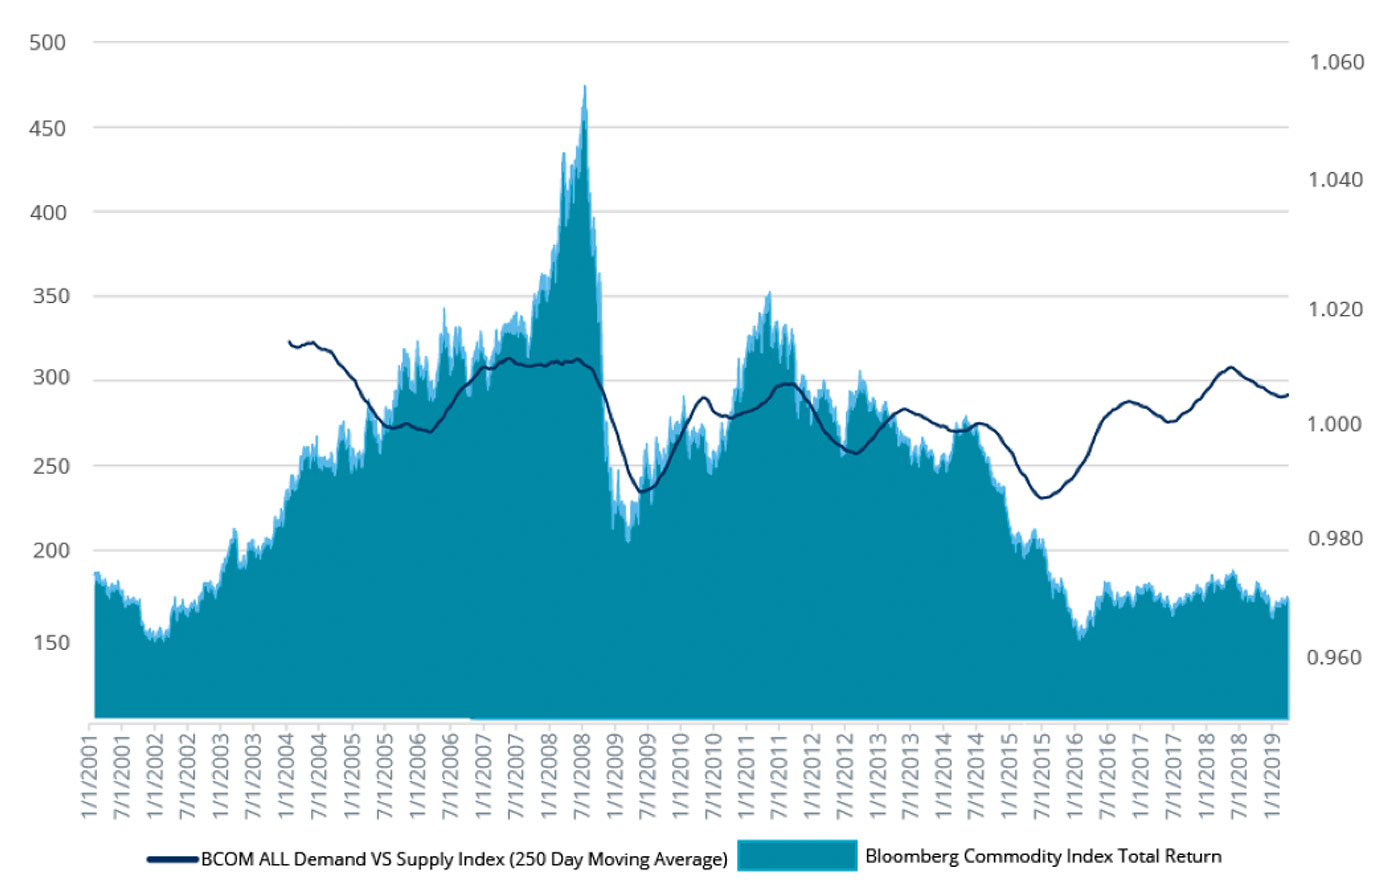
Note: The left-hand scale represents Index value, and the right-hand scale is ratio.
Source: Bloomberg
With the recent global economic data showing a slowdown and even contraction in some areas, there seems to be a growing sentiment for additional government stimulus in some countries, most notably China. Recently, China announced further stimulus that includes a commitment to more infrastructure spending. This could be a potential boost, particularly for industrial metals such as Copper. Some feel the global economic data has bottomed, and that could help signify a recovery for commodities.
Regardless, more global stimulus should help the price action with commodities.
Commodities can be volatile and experience significant declines at times. That was quite evident in 2018, when only two out of the 12 commodities listed in Table 2 finished in positive territory (Natural Gas and Wheat) and several commodities showed double-digit declines.
When looking at individual commodity prices over the last 10 years, there can be major divergences in performance between individual commodities from one year to the next. Natural Gas, for example, was the worst-performing commodity on this chart in 2017, but it became the top performer in 2018. Table 2 illustrates the need to be nimble when allocating to commodities.
TABLE 2: INDIVIDUAL COMMODITIES PERFORM DIFFERENTLY OVER TIME (2009–2018)
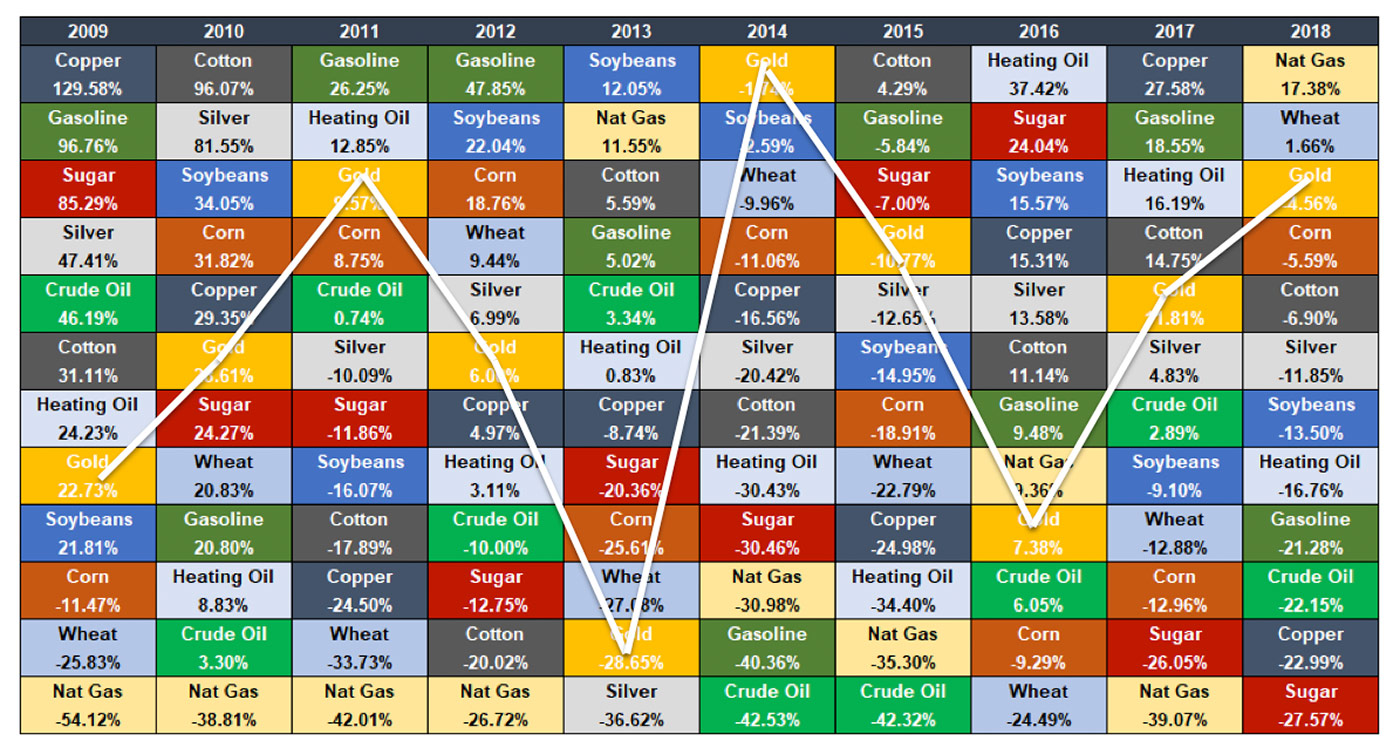
Note: The S&P GSCI is a composite index of commodity sector returns representing an unleveraged, long-only investment in commodity futures that is broadly diversified across the spectrum of commodities. The commodities listed in this chart represent some of the individual components of that index. They qualify for inclusion in the S&P GSCI on the basis of liquidity and are weighted by their respective world production quantities.
Source: Bloomberg. Date range: 2009–2018.
To smooth out the ride, it is important to invest in a broad basket commodity strategy that has the ability to be tactical. The Direxion Indexed Commodity & Income Strategy Fund (DXCIX) and Direxion Auspice Broad Commodity Strategy ETF (COM) seek to track a rules-based index called the Auspice Broad Commodity Index (ABCERI). This Index can be long or in cash with each of the individual 12 commodities that make up the Index.
Last year was difficult for most long-only commodity indexes—on average they were down 10%. By comparison, the ABCERI Index, with its ability to be tactical, was down only slightly for the calendar year. From a longer-term perspective (from when the ABCERI Index went live in the latter part of 2010), it has outperformed other notable long-only commodity benchmarks over that time, with lower risk characteristics.
With market developments in 2019 taking many unpredictable twists and turns, the narrative with commodities continues to be a “show me” story—but the pieces may be in place to see just that this year.
TABLE 3: ABCERI vs GSCI, BCOM, and DBC (10/31/10–12/31/18)
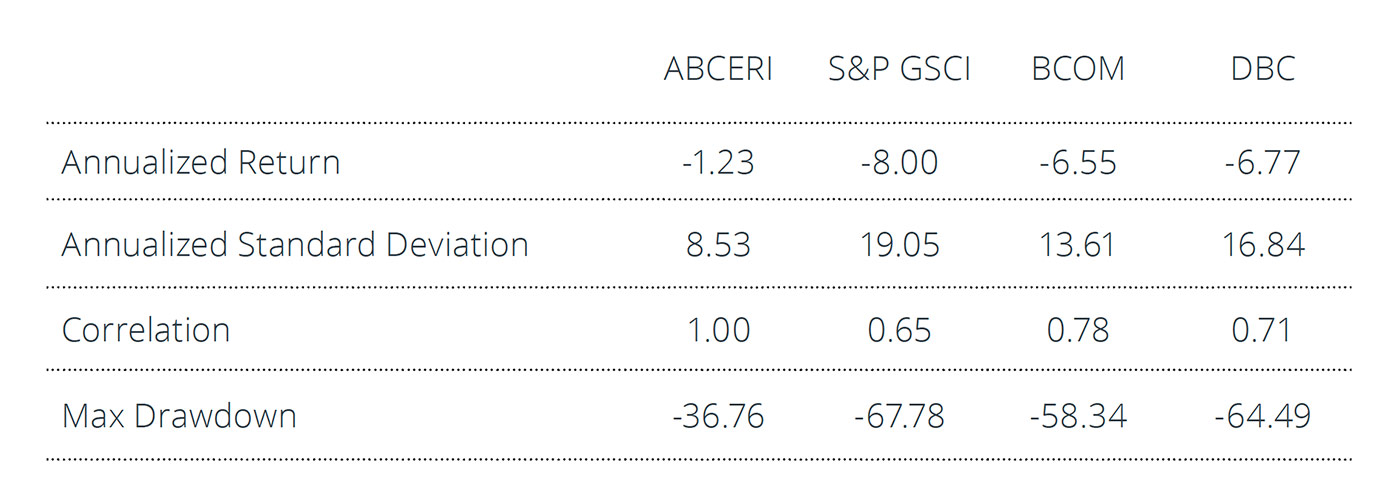
Note: Total returns of the Index include reinvested dividends. One cannot invest directly in an index. S&P GSCI represented by the S&P GSCI TR Index. BCOM represented by the Bloomberg Commodity Total Return Index. DBC represented by the DBIQ Optimum Yield Diversified Commodity ER Index.
Source: Bloomberg
The opinions expressed in this article are those of the author and do not necessarily represent the views of Proactive Advisor Magazine. These opinions are presented for educational purposes only.
An investor should carefully consider a Fund’s investment objective, risks, charges, and expenses before investing. A Fund’s prospectus and summary prospectus contain this and other information about the Direxion Shares. To obtain a Fund’s prospectus and summary prospectus call 866-476-7523 or visit direxioninvestments.com. A Fund’s prospectus and summary prospectus should be read carefully before investing.
The performance data quoted represents past performance. Past performance does not guarantee future results. The investment return and principal value of an investment will fluctuate. One cannot invest directly in an index.
 Edward (Ed) Egilinsky is managing director, head of sales and distribution, and head of alternative investments at Direxion. He focuses on global product implementation, promotes ETF education and strategy, and manages the Direxion ETF sales team. As head of alternative investments, Mr. Egilinsky drives the firm’s product development initiatives, messaging, and support of product delivery. Mr. Egilinsky previously worked in leadership roles at Price Asset Management and Rydex Investments.