
Inverse and leveraged funds investing: The perils of math

“Know your investment vehicle” is the first rule when it comes to successfully using alternative funds and ETFs.
Inverse and leveraged index funds and ETFs offer the promise of dramatically increased profitability by being on the right side of a market move. They can also be relatively efficient hedging vehicles.
With 2-beta (2x) leveraged funds, a 3% gain has the potential to become 6%. Using an inverse fund, a 20% fall in the market could translate into a substantial gain, depending on the accuracy of a manager’s signals. But before investors (or advisor strategies) jump into the alternative funds, an understanding of the mathematics of gains and losses is essential.

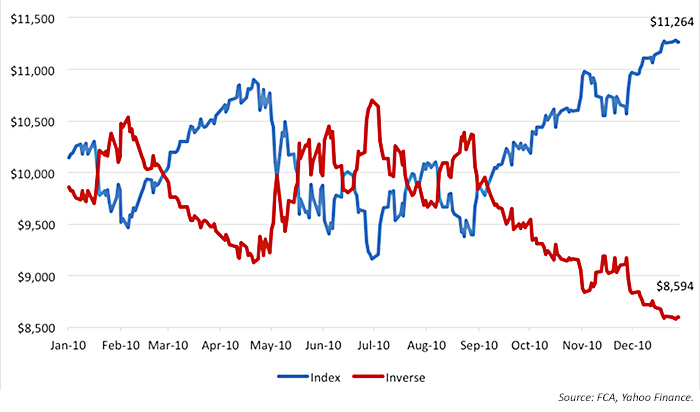
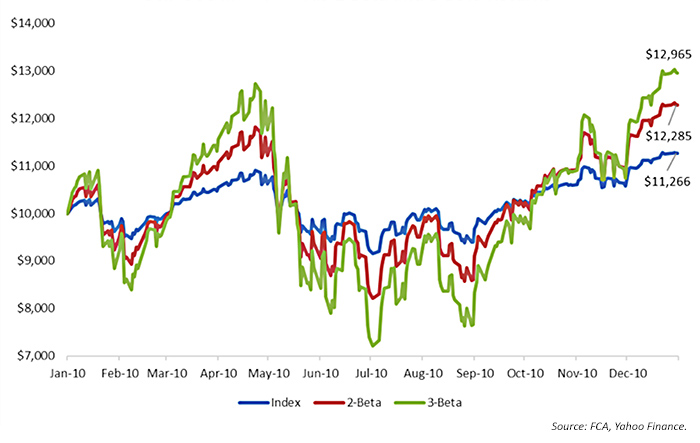
Based on $10,000 invested January 1, 2010, using S&P 500 data from Yahoo Finance. This is a hypothetical example and does not consider the impact of fees or trading costs.
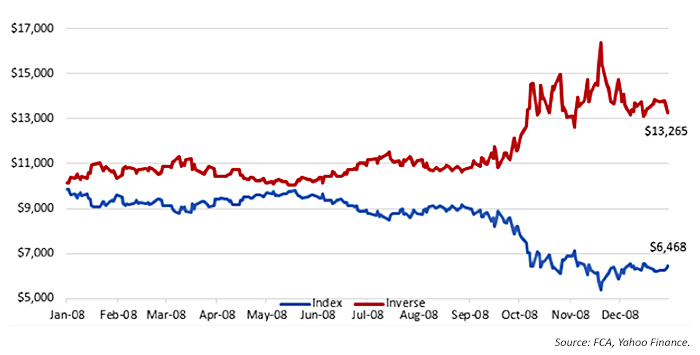
Based on $10,000 invested January 1, 2008, using S&P 500 data from Yahoo Finance. This is a hypothetical example and does not consider the impact of fees or trading costs.
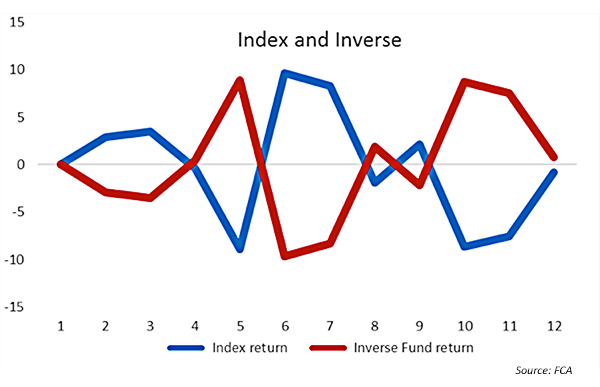
Even when the inverse fund is making money, as long as there is any volatility, the results will never be the exact opposite of the index. While inverse funds can be an effective tool for making money in a declining market, the parameters of the trading decision matter. In a volatile market, where losses are matched by gains, an investor could be relatively correct with respect to the overall market trend but could still conceivably lose money when using alternative funds. A 25% gain can’t offset a 25% loss.
Leveraged funds present a similar hazard in volatile or falling markets, where the mathematics of gains and losses can produce undesired results. Let’s look at the same two years: 2008 and 2010. But instead of comparing the S&P 500 Index to an inverse fund, the returns from 2-beta (2x) and 3-beta (3x) funds are used.
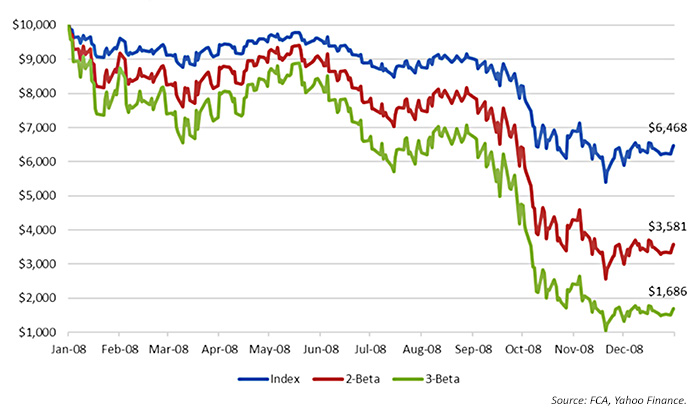
Based on $10,000 invested January 1, 2008, using S&P 500 data from Yahoo Finance. This is a hypothetical example and does not consider the impact of fees or trading costs.
Other than the obvious fact that one really doesn’t want to be in a 2- or 3-beta investment in a declining market, it’s interesting to note that although the daily returns are based on the exact same number times 2 or 3 for the beta returns, the end results range from a loss of 35% for the unleveraged S&P 500 Index to a 64% loss for the 2-beta and an 83% loss for the 3-beta returns. Ironically, what makes the losses less than what might be expected is that with each drop in the market there is less to lose.
Even in good years, leveraged 2- and 3-beta returns will generally not produce two and three times the performance of the index returns when market volatility and compounding are considered. They also have the potential to turn modest declines into major declines very quickly. Without the ability to foresee the market’s future upward trend, investors can be even more prone to the classic error of buying high and selling low.
Based on $10,000 invested January 1, 2008, using S&P 500 data from Yahoo Finance. This is a hypothetical example and does not consider the impact of fees or trading costs.
Again, the key reason is the mathematics of losses and compounding over time. If the S&P 500 is down 3% in one day, it takes a 3.1% gain to return to breakeven. A 6% loss (2-beta) requires a 6.4% gain, while a 9% loss from a 3-beta investment would require a 9.9% gain. While the difference may seem relatively minor, every loss pulls down the leveraged fund’s performance. The lower the account value at a given point in time, the less impact gains have to improve performance.
In a white paper on this topic, “Volatility Matters,” Direxion Funds cautions, “Direxion’s leveraged ETFs seek daily goals, which means that the returns of the ETFs over time should not be expected to be a multiple of the cumulative return off the benchmark for the longer period. … Daily rebalancing funds are not meant to be held unmonitored for long periods. If you intend to hold leveraged ETFs for periods greater than a day, you must always watch them closely.”
Inverse and leveraged funds are tools for enhanced performance that must be used with care. There are active investment managers who have made these tools a successful part of their strategies, but they have a firm understanding of the vulnerabilities and performance limitations inherent in alternative funds. Successfully managed active investment strategies are based on limiting losses and taking advantage of market trends. If the manager does not align trend and tool, alternative funds such as inverse and beta funds may not always deliver the performance that could logically be expected.
“In addition to the compounding impact of inverse and leveraged products, returns can also be dramatically influenced by the path dependency of the underlying index,” says Ed Egilinsky, managing director and head of alternatives at Direxion. He adds that Direxion has a daily reset of leverage for their ETFs, as well as a monthly rebalance of leverage within their tradable mutual funds. These products, especially those with higher leverage points (2x or 3x), Mr. Egilinsky says, “are primarily designed for tactical investment advisors with a short-term trading time horizon.”
It is important to note that there are few investment vehicles a manager can use to increase portfolio values during declining markets. Inverse funds are a valuable tool to meet this need and can move a strategy from just playing defense in a down market to actually seeing portfolio gains (or at least significantly mitigating losses). Leveraged funds also have the potential to turn lackluster market performance into respectable gains. But investing in inverse and leveraged funds is best done in collaboration with experienced investment managers who understand their performance and risks and can actively monitor and manage the funds.
 Linda Ferentchak is the president of Financial Communications Associates. Ms. Ferentchak has worked in financial industry communications since 1979 and has an extensive background in investment and money-management philosophies and strategies. She is a member of the Business Marketing Association and holds the APR accreditation from the Public Relations Society of America. Her work has received numerous awards, including the American Marketing Association’s Gold Peak award. activemanagersresource.com