

One caveat
There is one caveat. The market has to be in an established trend before a simple trend-following system will work. Simple systems can generate numerous false signals during choppy times. Trying to follow trend-following systems when there is no trend can metaphorically have you “chasing your own tail.”
The bowtie
I’m proud of the fact that signals off of my “bowtie” pattern can do a good job of keeping you on the right side of the market, especially during emerging trends. The bowtie is simply a crossing of the 10-day simple moving average, 20-day exponential moving average, and the 30-day exponential moving averages over a short period of time, giving the appearance of a “bowtie.” For an emerging downtrend this would mean the 10sma > 20ema > 30ema crossing quickly (ideally) over to 10sma < 20ema < 30ema. The crossing signals that the old trend may be ending and a new one may be emerging. The trigger would be a resumption of the new trend after a one-bar pullback.
Not every bowtie will turn into the mother-of-all tops/bottoms, but virtually all tops and bottoms will have a bowtie. In the S&P 500, I like to watch the weekly bowties. A major signal can occur when a bowtie forms for sells/buys after the market reaches significant (ideally 5-year-plus) new highs or lows. These can be quite powerful, since most people are trapped on the wrong side of the market. Notice in the S&P chart that the beginnings of major bull and bear cycles over the last 15 years were signaled with the pattern.
S&P 500 INDEX VS. 50-DAY SIMPLE MOVING AVERAGE
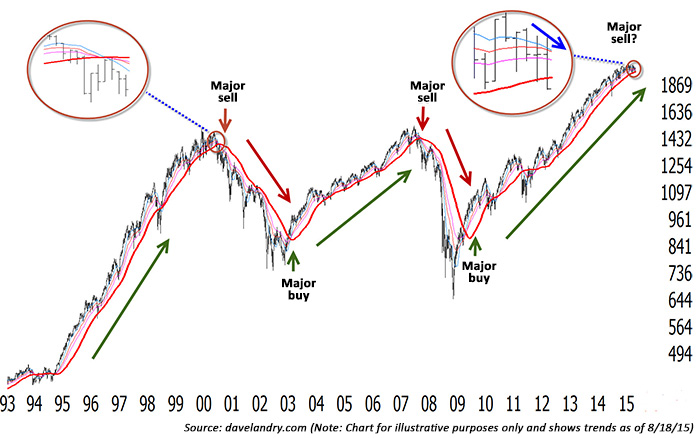
Even simpler?
I often like to plot a 50-period simple moving average for a reference when studying bowties. It is clear from looking at bowtie signals that the slope of the 50sma would have done a very good job of keeping you on the right side of the market. Notice that the slope of the average was positive during the roaring bull market of the 1990s, before turning down in 2000.
Subsequent bull and bear cycles could have been ridden simply by staying long when the slope remained positive and short (or out) as long as the slope remained negative. Obviously, the caveat is that since all indicators have lag, you still have to honor your stops on positions during adverse market moves versus waiting around for signals.
So, where are we now?
Over the past week, the S&P 500 has broken down decisively from its range. There is now downside “daylight” between the highs and the 200-day moving average, the 50-week moving average has turned down, and we could see a weekly bowtie major sell signal soon. This leaves us at an inflection point.
It will be important for the market to get back into, and, ideally, above its prior trading range, otherwise this could be the start of a new leg down. I wouldn’t rush out and call it a major bear top just yet, but you should be selective on the long side. Hopefully, we are just seeing a normal correction and the market can resume its longer-term trend.
The opinions expressed in this article are those of the author and do not necessarily represent the views of Proactive Advisor Magazine. These opinions are presented for educational purposes only.
 Dave Landry has been trading the markets since the early 1990s and is the author of three books on trading. He founded Sentive Trading LLC in 1995 and since then has been providing ongoing consulting and education on market technicals. He is a member of the American Association of Professional Technical Analysts and was a registered Commodity Trading Advisor (CTA) from 1995 to 2009. davelandry.com