

Stock and index charts are a graphical representation of many things. Often times the price or value action reflects speculation, which occurs when price rises beyond fundamental values.
Since fundamentals are the foundation and principles of good long-term investments, it is important to be able to easily identify where fundamentals support price.
This is done by identifying where dark-pool buy-side institutions were last accumulating the stock. Dark pools are nontransparent exchanges that came into existence to facilitate large block trades by institutional investors, minimizing adverse price action.
With more than $2 trillion in corporate buybacks in less than one and a half years, stock prices have moved up in large part because of buybacks, leaving fundamentals playing a lesser role in stock valuation.
This can create sudden downside action as buy-side institutions rotate out of stocks, in turn lowering inventories of trust-held stocks for ETFs and mutual funds. When fundamentals fall too far behind the technical price levels, “Dark Pool Quiet Rotation” candlestick patterns begin.
As stocks correct in their trends to adjust for this speculative price action, investors often wonder how far the stock will fall. The answer is that they will fall back to previous “Dark Pool Buy Zones” where buy-side institutions instigated their initial “Dark Pool Quiet Accumulation.” Buy zones are areas with very precise controlled price action that forms a sideways candlestick pattern called a “Platform,” which is a narrow sideways price pattern.
Platform candlestick patterns form due to the type of orders the buy-side institutions use to control and bracket their accumulation orders. Their goal is to buy in at a set price range. When the stock price falls into their “Dark Pool Buy Zone,” quiet accumulation automatically triggers time-weighted at average price orders. These are not weighted on volume but on price itself, hence the very uniform price pattern.
A platform candlestick pattern tends to be approximately 10% of the range of the stock price width. This provides ample room to control the price while in a steady, slow quiet accumulation over several weeks to months. Platforms will often build between earnings seasons for about three months. These patterns can help investors determine whether to hold a stock through a corporate business bear cycle, to sell, or lower shares held. It also helps investors determine where to place a long-term stop-loss that will not whipsaw them out of their long-term position, unless the market is in an actual bear market rather than an intermediate-term correction.
Many investors make the mistake of using a 10% stop-loss, which is often too tight and too obvious for high-frequency trading firms and other predatory automated systems. When an investor uses fundamental support levels from chart analysis, they avoid the common pitfall of having a stop-loss trigger on a minor correction.
The following Nvidia Corporation (NVDA) chart identifies a “Dark Pool Buy Zone” that was approached several times over the last year. The levels were established in late 2016. The prior “Buy Zone” from 2014–2015 is outlined on the chart as well.
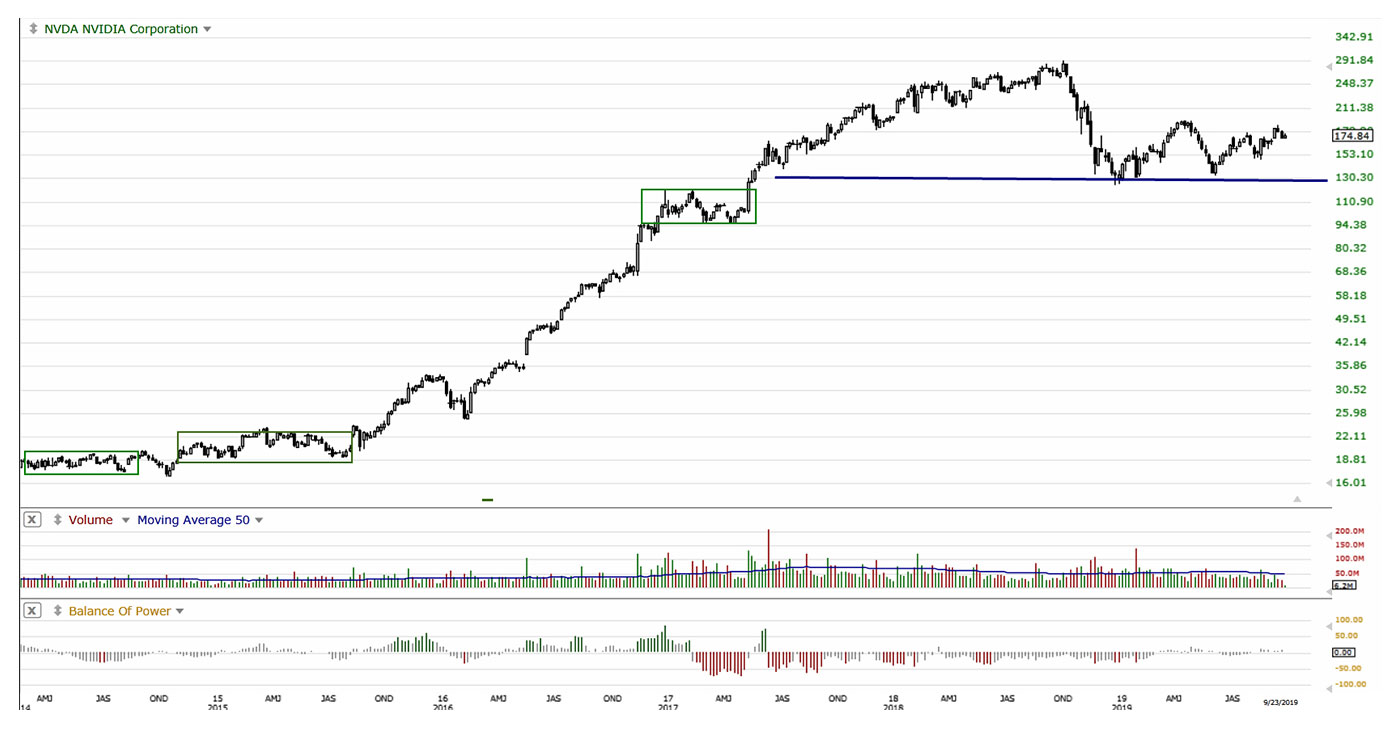
Source: TechniTrader; technical analysis using a TC2000 chart, courtesy of Worden Bros. Data as of 9/23/19.
The NVDA chart shows fundamental support levels. The candlestick pattern is consistent with “Dark Pool Buy Zones” of prior periods. This is the level at which this stock is most likely to find support after a bearish downtrend cycle, as this is where buy-side institutions determined fundamentals were higher than the price value at that time. The speculation of price often goes far beyond fundamental values. When a stock trends down it tends to stop at the prior “Dark Pool Buy Zones,” as time-weighted average price orders are set and waiting to trigger when the stock enters the “Buy Zone.”
When a company is in a growth cycle upward, these platform candlestick pattern “Dark Pool Buy Zones” will steadily move up over time and follow the trend of the fundamentals.
 Martha Stokes, CMT, is the co-founder and CEO of TechniTrader and a former buy-side technical analyst. Since 1998, she has developed over 40 TechniTrader stock and option courses. She specializes in relational analysis for stocks and options, as well as market condition analysis. An industry speaker and writer, Ms. Stokes is a member of the CMT Association and earned the Chartered Market Technician designation with her thesis, "Cycle Evolution Theory." technitrader.com