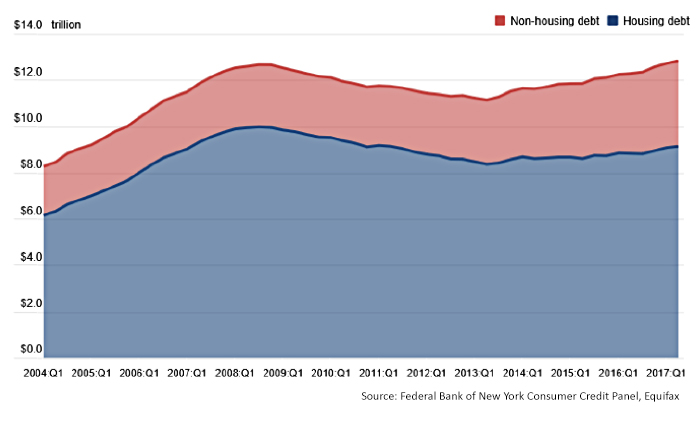
According to data compiled by the Federal Reserve Bank of New York and released in August, U.S. household debt has reached an all-time record, surpassing levels last seen before the depths of the financial crisis.
The study says, “Aggregate household debt balances increased in the second quarter of 2017, for the 12th consecutive quarter, and are now $164 billion higher than the previous (2008Q3) peak of $12.68 trillion. As of June 30, 2017, total household indebtedness was $12.84 trillion, a $114 billion (0.9%) increase from the first quarter of 2017. Overall household debt is now 15.1% above the 2013Q2 trough.”
FIGURE 1: TOTAL U.S. HOUSEHOLD DEBT BALANCE SINCE 2004
What is driving consumer debt levels higher?
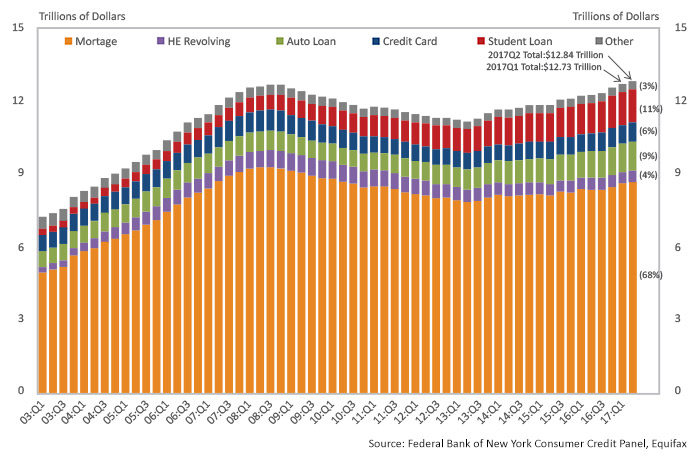
As shown in Figure 2, the categories of student loan debt and auto loans have shown consistent growth since 2013. This should not be surprising. The coming of college age by boomers’ children, combined with the depressed salaries since the credit crisis and rising tuitions, simply means more families have had to turn to student loans. Auto loans reflect the recovery in the U.S. automobile sector since the credit crisis, and the fact that consumers who were economically forced to hold onto aging vehicles finally re-entered the car market over the past several years. Mortgage loans, the largest category of consumer debt, have also consistently increased since 2013, reflecting a more stable consumer able to take advantage of low interest rates.
FIGURE 2: TOTAL DEBT BALANCE AND ITS COMPOSITION
Should record levels of consumer debt be flashing warning signs reminiscent of the credit crisis?
Some observers think so. A column in the Los Angeles Times business section in 2016 said,
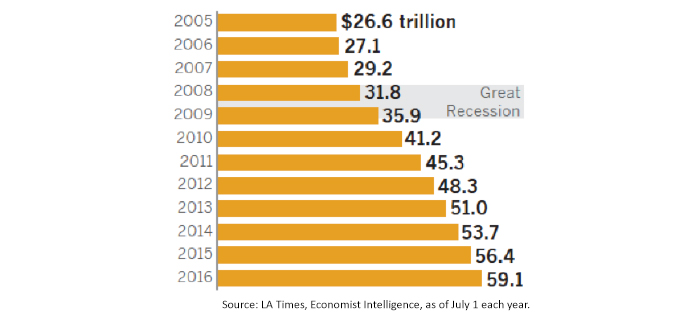
“Eight years ago, unsustainably high debt was the root cause of the worst recession since the Great Depression. Yet world debt overall now is far above the 2008 levels. And as with millions of American home buyers back then, many of today’s borrowers owe amounts that could become crushing burdens if the global economy should careen into a new recession. The overstretched include plenty of governments. Total government debt outstanding was worrisome in 2008. It has since doubled to $59 trillion, according to Economist Intelligence.”
FIGURE 3: GLOBAL GOVERNMENT DEBT
According to the Federal Reserve, consumer credit in July 2017 increased at a seasonally adjusted annual rate of 6%. Revolving credit increased at an annual rate of 3.25%, while nonrevolving credit increased at an annual rate of 7%.
All of these monthly trends exceed levels of GDP and wage growth, which does create concerns for some analysts if the trends continue without household income showing similar trended growth. However, the record levels of household debt do not seem overly concerning to Fed officials. According to a research officer at the Federal Reserve, says a blog at Saldutti Law, the record is “neither a reason to celebrate nor a cause for alarm.”
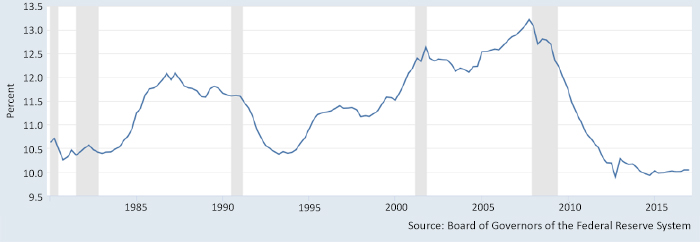
The reassuring news is that household debt as a percentage of total GDP and as a percentage of disposable income are both at relatively low historical levels, and much lower than those seen in the 2007–2009 period.
FIGURE 4: HOUSEHOLD DEBT TO U.S. GDP
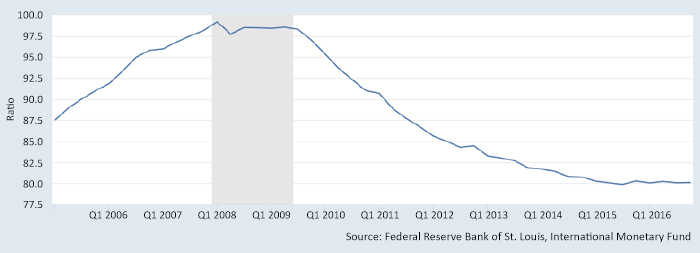
FIGURE 5: HOUSEHOLD DEBT SERVICE AS % OF DISPOSABLE INCOME