


The world was convinced that inflation was imminent, that bond yields were rising, and thus that investors ought to dump anything bond-related. The 10-year Treasury note was assuredly headed north of 3%, people were going to stop taking out mortgages, companies were going to stop investing, and inflation was going to be the “new normal.”
But wait! That sentiment appears to have been overdone, and bond prices have become oversold.
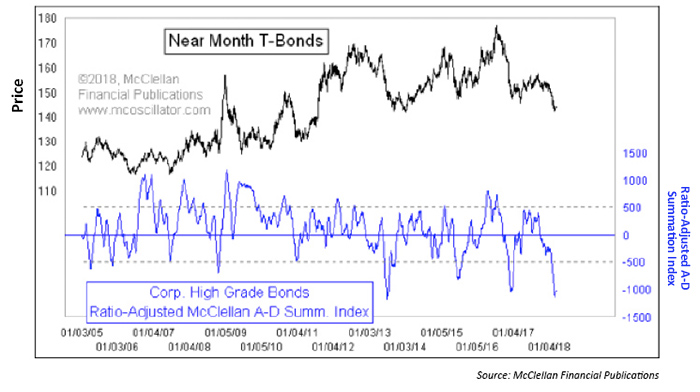
We can measure the oversold condition of T-bond prices in a large variety of ways, but Figure 1 looks at a different set of data to get a unique insight.
FIGURE 1: BOND PRICES VS. OVERSOLD/OVERBOUGHT INDICATOR
FINRA publishes advance-decline (A-D) data on corporate bonds daily. The data are broken down into “Investment Grade,” “High Yield,” and “Convertible.”
The high-yield A-D data have great interest for me in terms of the messages they can give for the stock market (see this “Chart In Focus” article). And the investment-grade A-D data have importance for what lies ahead for T-bond prices.
Figure 1 looks at a ratio-adjusted summation index (RASI) for the investment-grade-bond A-D data. The qualifier of it being a “ratio-adjusted” summation index means that a mathematical adjustment has been made to factor out changes in the numbers of issues traded. For an elaboration on the math, see the article “RASI or Classic—Which Summation Is Better?” The short version of the description is that this process makes long-term comparisons more meaningful.
The summation index measures the acceleration that takes place in the A-D statistics. This can convey several messages, depending on the context. The message right now is that the high-grade area of the bond market has gotten extremely oversold, and thus at least a chance for a bounce is due right now. Plus, a larger move up is in the script for later.
The FINRA bond A-D data only go back as far as 2005. We wish we had perfect data further back. Barron’s used to carry A-D data on “corporate bonds” (without elaboration), which we have kept for many years. Here is a look back at that data in Figure 2.
FIGURE 2: ‘CORPORATE’ BONDS RATIO-ADJUSTED DAILY A/D LINE (1991–2002)
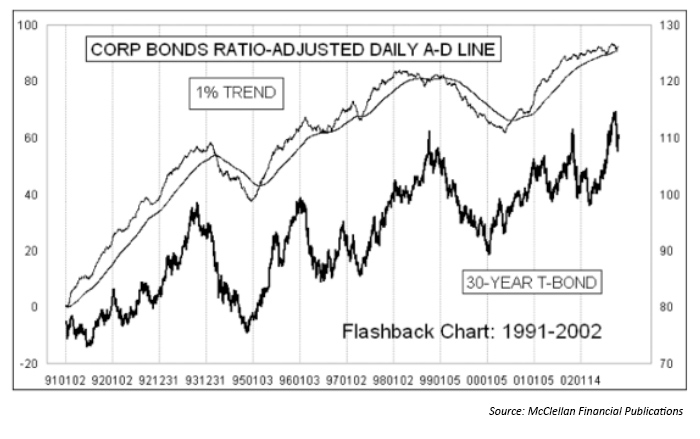
The numbers of issues back then were much smaller, but we can still see the relationship to T-bond prices. It is not perfect, of course, and it missed a lot of the turns that came in T-bond prices.
The more current data seem to be better and more useful. And the application of the math of the McClellan Summation Index makes it even more useful.
We just saw a very low reading in the high-grade-bonds RASI, nearly the equal of the low seen in 2013. This is a message that the corporate-bond market has become very oversold. But it is not an unequivocal message about what comes next.
Sometimes a very low RASI reading like this marks an exhaustive bottom for T-bond prices. But other times there needs to be another price dip before the final low is in and prices are free to trend upward. Given the small sample size of instances since the data begin in 2005, I have not figured out a way to tell the difference between the two types of outcomes. While we see the big, fat oversold reading on the RASI, I cannot prove yet that a retest of the price low is off the table.
The takeaway is that even if there is a retest of the price low, we still can expect higher T-bond and high-grade corporate-bond prices in the weeks and months ahead. And that will frustrate the legions of analysts expecting higher inflation and higher interest rates.
The opinions expressed in this article are those of the author and do not necessarily represent the views of Proactive Advisor Magazine. These opinions are presented for educational purposes only.
This article was first published by McClellan Financial Publications on March 14, 2018.
 Tom McClellan is the editor of The McClellan Market Report newsletter and its companion, Daily Edition. He started that publication in 1995 with his father Sherman McClellan, the co-creator of the McClellan Oscillator, and Tom still has the privilege of working with his father. Tom is a 1982 graduate of West Point, and served 11 years as an Army helicopter pilot before moving to his current career. Tom was named by Timer Digest as the #1 Long-Term Stock Market Timer for both 2011 and 2012. mcoscillator.com