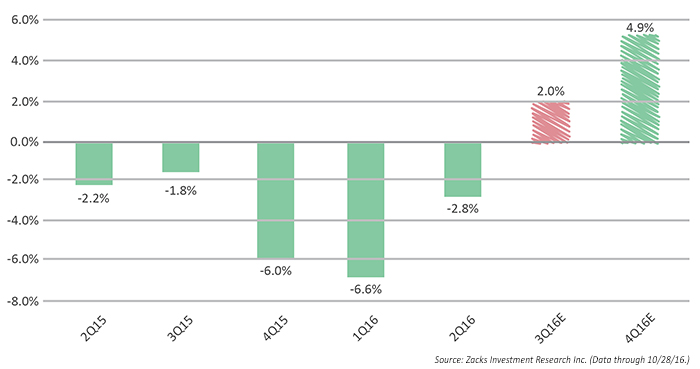
However, with over 50% of S&P companies reporting through the end of last week, prospects for the quarter have brightened considerably. Recent commentary from Zacks noted:
“The pattern of earnings declines that we became used to seeing quarter after quarter has finally come to an end, with the Q3 earnings season on track to produce positive earnings growth for the first time in 6 quarters. … The +2% earnings growth in Q3 (combining the actual results from the 291 index members that have reported already with estimates for the still-to-come 209 companies) may not seem like much, but it is nevertheless a notable improvement over what we saw in the preceding 5 quarters.”
According to FactSet, several factors are driving the improved earnings outlook:
- All eleven sectors have higher growth rates today (compared to September 30) due to upside earnings surprises. The Energy (+38.4%), Real Estate (+17.8%), Utilities (+13.6%), and Financials (+9.1%) sectors are reporting the largest upside aggregate differences between actual earnings and estimated earnings.
- The Financials sector has been the largest absolute contributor of all eleven sectors to the rise in earnings growth for the index since the end of the third quarter. This sector accounts for $3.6 billion (or 36%) of the $10.1 billion increase in earnings for the S&P 500 since September 30. 87% of financial companies have reported actual EPS above estimated EPS.
- More companies in general are reporting actual EPS (74%) and actual sales (58%) above estimates compared to 5-year averages. In aggregate, companies are reporting earnings that are 6.7% above the EPS estimates. This percentage is above the 5-year average (+4.4%).
- S&P 500 companies are reporting sales that are 0.8% above expectations. This percentage is above the1-year (0.0%) average and above the 5-year (+0.6%) average. 58% of companies have reported actual sales above estimates. The percentage of companies reporting sales above estimates is above the 1-year average (50%) and above the 5-year average (54%).
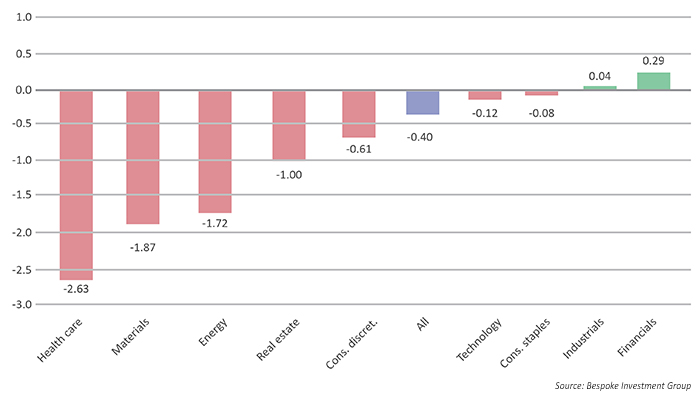
Interestingly, the stock market has not been particularly kind to companies this earnings season in the day immediately following their earnings reports—despite the more positive earnings picture.
External factors and lackluster recent market overall performance may be part of this phenomenon, but the data is striking. Bespoke Investment Group charted this effect for companies reporting as of October 26, saying, “It appears as if investors have simply been ‘selling the news’ this week regardless of the actual earnings numbers; there have been some winners, but there have been numerous earnings reports where the numbers came in stronger than expected and investors simply sent shares lower. … That took the average one-day price change for all stocks reporting this season down to –0.40%.”