


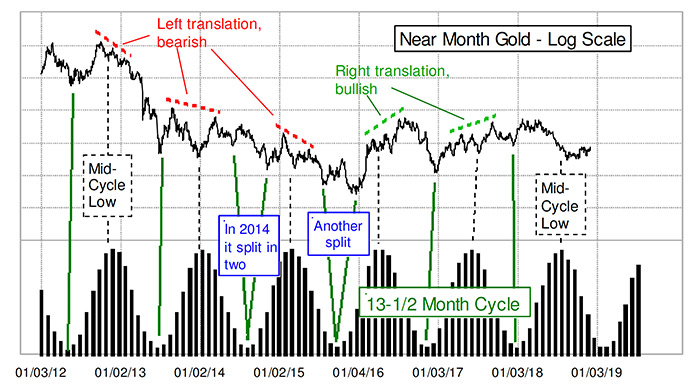
About every 13 and a half months, gold prices see an important price bottom, and the next one is due in February.
Now, before you start marking your calendars, understand that actual bottoms have historically arrived plus or minus a month from the predicted date, so this cycle is not always as precise as we might like it to be.
It is still an important cycle, though, and not just because of the timing of the major cycle lows. There is also typically a significant midcycle low, which appears to have arrived in August 2018 this time. And the arrangement of the price tops on either side of that midcycle low gives us important insight into what lies ahead.
When there is a higher high late in the cycle, that is called “right translation,” and it is a bullish sign for what prices should do after the major cycle low. A “left-translation” condition is bearish, and it says that the price level of the midcycle low ought to get taken out going into the major cycle low. We appear to have a left-translation in this current cycle, which says that gold is going to be in trouble whenever it starts its downturn toward that major low due in February (Figure 1).
Source: The McClellan Market Report
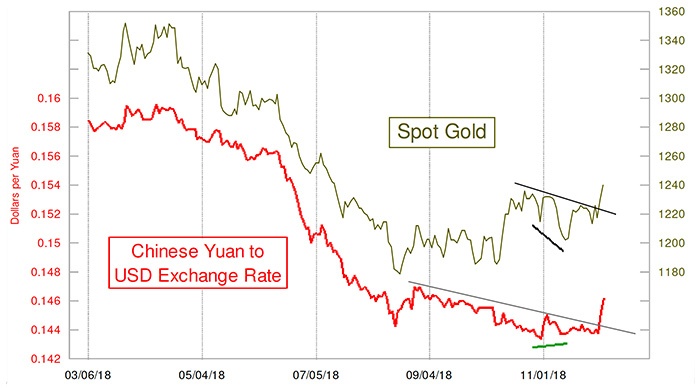
Recently, gold has been making a valiant effort to rally, and it is getting some support from the Chinese yuan. The two have been in a very tight correlation since around the summer of 2016. Figure 2 shows that relationship for just this year. Gold prices started higher than the Aug. 17 low but did not really seem to have the yuan’s permission to proceed further. The yuan hinted at a change in early November when it made a divergent higher low. Now both gold and the yuan have broken their declining tops’ lines, helped by optimism about trade tensions easing. Gold now has a pattern of higher lows and higher highs, which is bullish for the moment (data as of 12/5/18).
Source: The McClellan Market Report
Source: The McClellan Market Report
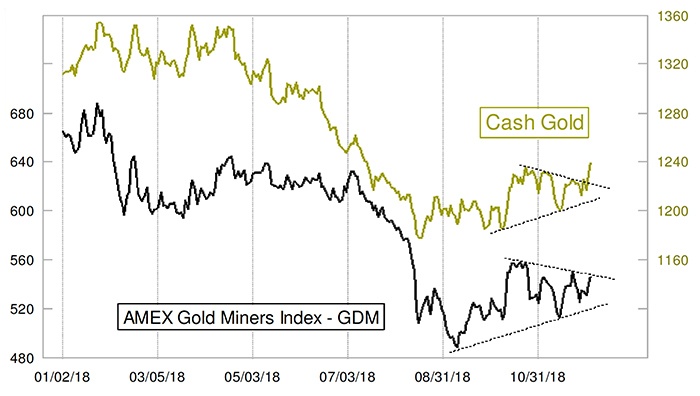
This is a conflict that could get resolved if gold mining stocks continue to move higher and have their own breakout move. Gold’s own triangle breakout gives us an upside objective of around $1,280 per ounce, based on taking the height of the triangle and adding it to the breakout point. But there is a reason that chartists use the term “objective,” and not “guarantee.” Gold’s breakout could fail and turn around. If that happens, then we should consider the drop to the 13-and-a-half-month cycle low as having started.
Bottom line: Gold has a major 13-and-a-half-month cycle low due in February, and that low should see gold prices drop below 1,200. A timing-model signal of a bottom for gold says that this cycle low could arrive a bit early, in late January. Gold does not have to start down toward that cycle low yet and appears to want to go a little bit higher first.
The opinions expressed in this article are those of the author and do not necessarily represent the views of Proactive Advisor Magazine. These opinions are presented for educational purposes only.
This article was first published by McClellan Financial Publications on Dec. 5, 2018. All price information as of that date.