

It is said that the early bird gets the worm, but the second mouse gets the cheese. So, as investors, if we can identify a good first mouse to follow, then we can find the treasure.
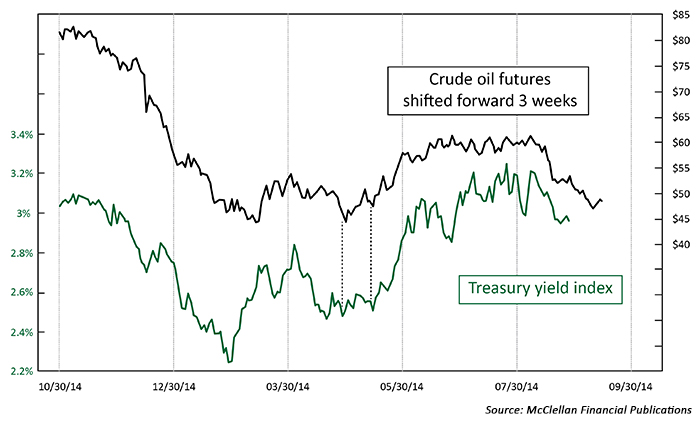
Over the years, I have encountered several of these leading indication relationships, and one of the more fun and useful ones is the message from crude oil prices for bond yields. If we take the price plot of crude oil futures and shift it forward by three weeks in the chart, we get a pretty good diagram of what T-bond yields are going to do over the next three weeks.
This is relevant for investors because T-bond prices move inversely to bond yields. So a message that bond yields are likely to go down is the same as a message that bond prices should go up.
It sort of makes sense that bond yields should respond to the movements of crude oil, since oil prices have a big impact on inflation rates, and inflation is the enemy of low bond yields. But why the lag time works out so precisely to exactly three weeks is something I cannot explain. Explanation or not, the evidence is pretty compelling that there is a leading indication relationship, and it has been going on for a lot longer than the period shown in the chart.
I have heard Wall Street forecasts for oil prices heading into the $30s, and I have seen other evidence calling for $60/barrel oil,
especially if the value of the dollar starts to fall. Differentiating among all of these conflicting indications would be a big problem if you are a crude oil trader.
But if you are a bond investor, you only need to wait and watch to see what oil prices actually do, and you can expect that bond yields will follow in those same footsteps over the following three weeks. That is admittedly a shorter time horizon than a lot of bond
investors like to employ, but professional money managers have a need for knowing about short-term trend information even if they are not going to trade every turn.
Suppose you are a bond fund manager, and you have some new cash to put to work. Do you put it into your list of bonds right away, ignoring market-timing signals? Or do you take a look at what crude oil has been doing over the past three weeks and pick your spot for when to invest that new cash? This leading indication from crude oil prices can be useful for even “buy-and-hold” investors in this way, to help pick your entry or exit points for that marginal cash that may come in or out of the market.
The opinions expressed in this article are those of the author and do not necessarily represent the views of Proactive Advisor Magazine. These opinions are presented for educational purposes only.
 Tom McClellan is the editor of The McClellan Market Report newsletter and its companion, Daily Edition. He started that publication in 1995 with his father Sherman McClellan, the co-creator of the McClellan Oscillator, and Tom still has the privilege of working with his father. Tom is a 1982 graduate of West Point, and served 11 years as an Army helicopter pilot before moving to his current career. Tom was named by Timer Digest as the #1 Long-Term Stock Market Timer for both 2011 and 2012. mcoscillator.com