


I often talk about indicators that provide active readings, but today I am going to discuss one that has been quiet for an unusually long period of time. The Quantifiable Edges Capitulative Breadth Indicator (CBI) is an indicator I created in 2005 (I generated readings back to 1995 and have tracked it live since). When Quantifiable Edges began in January 2008, it was the topic of the third blog post I ever published there, and I have written about it many times since. What is notable now is what it has failed to do for a long time. Specifically, the overall market and leading stocks have not seen a real spike in capitulation selling since 2015.
But before we look at the indicator, let’s discuss what it represents. To measure capitulation selling in individual stocks, I use my proprietary Catapult System. To develop it, I conducted many studies focused on identifying capitulation selling situations. In doing so, I managed to discover a few key characteristics that I used to locate likely reversal areas. A core requirement is that an existing trend sees a strong downward acceleration. This is the essence of the Catapult System.
The CBI is basically just a count of the number of open catapult triggers among S&P 100 stocks. My basic finding has been that high CBI readings, which have occurred during market sell-offs, have often been followed by strong reversals. Basically, the more major individual stocks you have suggesting that selling has become too extreme, the more likely a broad market reversal becomes.
You can see the CBI in the bottom panel of the following daily chart of the S&P 500 Index. Since I generally trade vehicles based on the S&P 500, I find the SPX can replace the S&P 100 for analytical purposes.
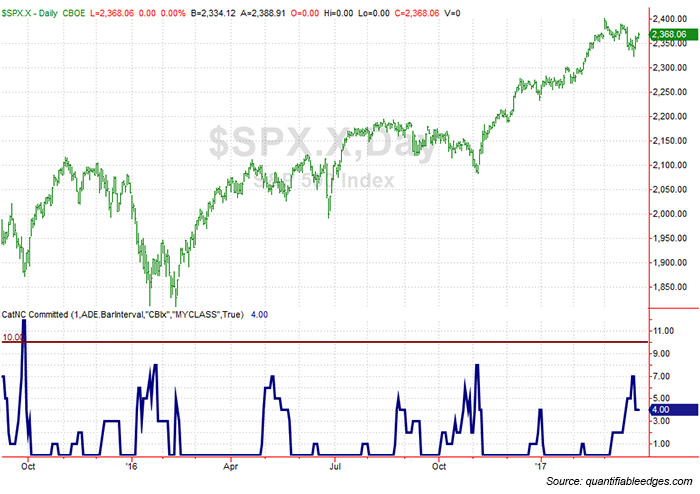
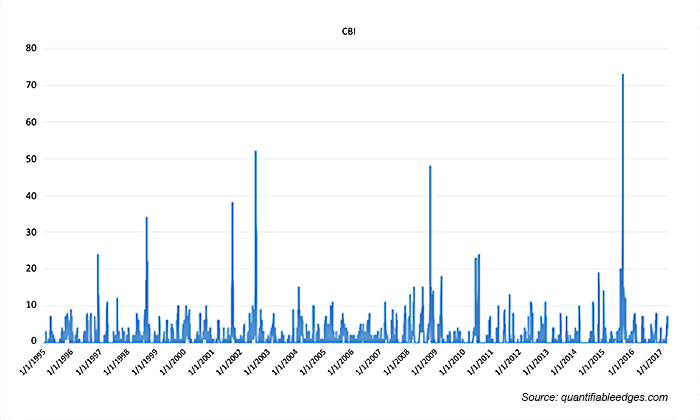
Since 1995, the CBI has reached 10 or higher on 35 different occasions, meaning a sizable spike occurs once every 7-8 months. But the January 2016 sell-off failed to generate a large spike, and there has not been a substantial sell-off and spike since then. So we have now gone more than 18 months without the CBI reaching 10. Since 1996, there has been only one other instance when the market has gone this long without a capitulation spike: April 2005 to February 2007, a span of 22 months. Then, the bear market hit in late 2007, and there were five spikes over 10 between November 2007 and October 2008.
The following chart shows the CBI since 1995 to provide a historical perspective.
I am not suggesting the next bear market is around the corner. I am suggesting we have experienced a very long period of low volatility. According to the CBI, we are now quite overdue for some type of volatility event, if not something more substantial.
From a seasonal pattern standpoint, the market is getting ready to enter the “worst six months” of the year: May through October. We are also in the first year of a new presidency, and that has often been accompanied by volatile markets. So I would caution traders not to get too complacent. Volatility has been absent for a long time, and I suspect it will not be too long before it returns. Of course, when it does return, I’ll be looking to the CBI to provide clues of selling exhaustion to help me time market entries.
Much more information on the Catapult System and the CBI can be found at QuantifiableEdges.com. No matter what tools you use to help you get through volatile markets, you may want to have these also at the ready.
 Rob Hanna has worked in the investment industry since 2001. He is the founder and publisher of Quantifiable Edges, a quant-based website where he also publishes a newsletter. After managing a private investment fund through Hanna Capital Management LLC from 2001 to 2019, Rob joined Capital Advisors 360, where he now serves as a registered investment advisor and focuses on short-term and quantitative strategies. quantifiableedges.com