

Said Barron’s this past weekend,
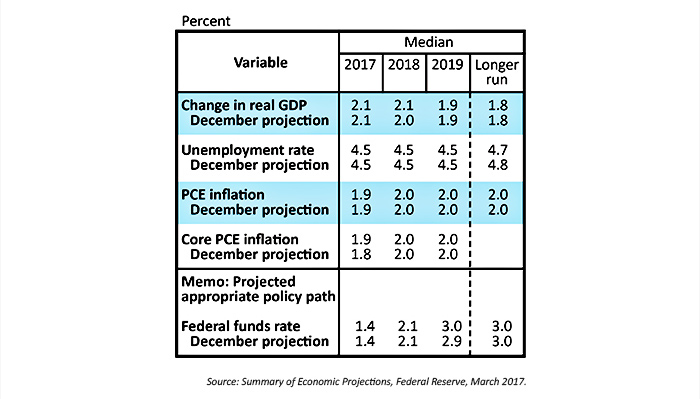
“Even though the Federal Open Market Committee boosted its federal-funds target rate by 25 basis points (one-quarter of a percentage point), to 0.75%–1%, the panel’s projections and Fed Chair Yellen’s post-meeting press conference disabused notions that the central bank would move faster and farther than some had thought. … Bottom line: Interest rates will remain lower, for longer than bond bears, who had been talking up the notion of four rate hikes this year, had feared.”
Two statements in the FOMC’s official release seemed particularly to reassure market bulls:
- “Information received since the Federal Open Market Committee met in February indicates that the labor market has continued to strengthen and that economic activity has continued to expand at a moderate pace.”
- “The Committee expects that economic conditions will evolve in a manner that will warrant gradual increases in the federal funds rate; the federal funds rate is likely to remain, for some time, below levels that are expected to prevail in the longer run.”
In her press conference remarks on March 15, Federal Reserve Board Chair Yellen was somewhat more enthusiastic about the FOMC’s outlook for the U.S. economy/GDP growth than the prepared statement might indicate, saying, “The simple message is the economy is doing well. … We have confidence in the robustness of the economy and its resilience to shocks. … I think it’s fair to say that many of my colleagues and I note a much more optimistic frame of mind among many, many businesses in recent months. … The shift in sentiment is obvious and notable.”
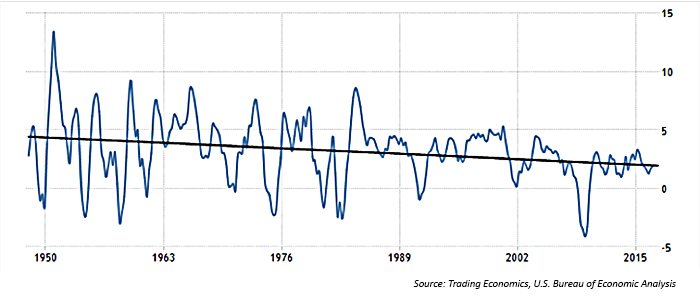
However, a 2% GDP growth rate seems reasonable in the context of the historical data going back to the late 1940s, even though the long-term trend line has been moving lower (Figure 2). It also is “right in line with the average for the last eight years,” says The Wall Street Journal.
FIGURE 2: U.S. GDP ANNUAL GROWTH RATE AND TREND LINE (POST-WWII PERIOD)
The key question, of course, is whether the Federal Reserve’s estimates for GDP are too conservative or too bold?
On the bearish side of the debate, the Atlanta Fed’s closely followed GDPNow forecast has been trending lower for its Q1 2017 forecast, which now stands at a very weak projection of 0.9%.
GDP forecast for 2017: Q1
Quarterly percent change (SAAR)
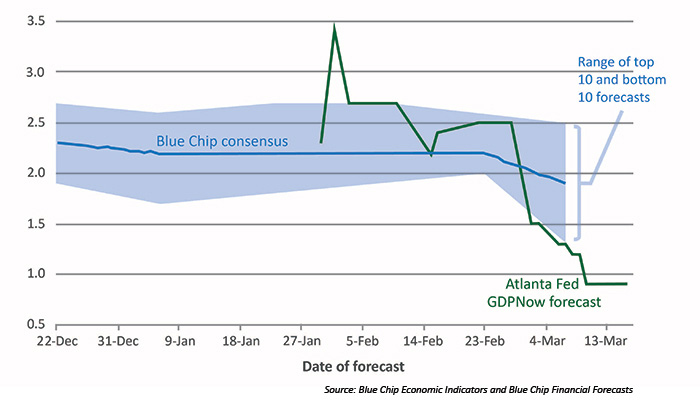
On the bullish side, equity markets certainly are demonstrating the belief that Trump administration policies will lift GDP growth above its current range. Vastly improved business and consumer sentiment measures since the election support that belief, although, to paraphrase Barron’s, the actual hard-data proof of economic activity usually takes six to 12 months to manifest itself.
On Monday, March 20, hard-data good news arrived already in the form of the Chicago Fed’s National Activity Index, which improved from -0.2 in January to +0.34 in February. According to Econoday/Barron’s, this lifted “the 3-month average to a 2-year high at plus 0.25.” Their analysis of the latest report says,
“The Chicago Fed National Activity Index (CFNAI) is a monthly index that tracks overall economic activity and inflationary pressures. The CFNAI is a weighted average of 85 existing monthly indicators of national economic activity. It is constructed to have an average value of zero and a standard deviation of one. Since economic activity tends toward trend growth over time, a positive index reading corresponds to growth above trend and a negative index reading corresponds to growth below trend.”