Ray Dalio, founder, chair, and CIO of Bridgewater Associates, LP (generally regarded as the world’s largest and most successful hedge fund, with over $150 billion in assets under management), shared this in a 2012 interview with
CNBC:
“I think gold should be a part of everybody’s portfolio to some degree because it diversifies the portfolio—it is the alternative money. We have a situation where we have too much debt. Too much debt leads to the printing of money to make it easier to service. … Money can be produced, [but the supply of] gold is somewhat limited.”
The literature from academia, the financial press, respected Wall Street firms, and the general investing community all generally come back to some basic assertions on the potential benefits of allocations to gold in a portfolio:
- As a hedge against inflation
- As a hedge against deflation
- As protection against a declining U.S. dollar (and other major global currencies)
- As a safe haven in times of geopolitical and financial-market instability
- As a basic commodity, with its own supply-and-demand fundamentals
- As a long-proven store of historical value
- As an “insurance policy” against black-swan and “long-tail” risk events
- As an asset with common (though not perfect) negative correlations with other asset classes
- As an investment with an underlying global central bank and sovereign wealth demand
- As an underowned investment class, suggesting future demand increases
- As an important portfolio diversifier
Each of these arguments can find its supporters and naysayers, all armed with their own particular analyses and biases. But even well-credentialed critics of gold grudgingly admit there is a place for it in most every investor’s portfolio.
In a recent paper titled
“The Truth about Gold: Why It Should (or Should Not) Be Part of Your Asset Allocation Strategy,” professor Campbell R. Harvey of Duke University’s Fuqua School of Business, summarized in part,
“The attractiveness of gold as an investment can generate heated arguments, many of which are based on wishful thinking rather than fact. … Most arguments for holding gold in a portfolio are not supported by an analysis of the data. Nonetheless, an argument can be made for including gold as a commodity in a well-diversified portfolio, particularly if investors and central banks increase their demand—even moderately—for gold.”
And an independent, proprietary study by
Oxford Economics concluded,
“We find that because of its lack of correlation with other financial assets, gold has a useful role to play in stabilizing the value of a portfolio even if the conservative assumption of a modest negative real annual return is made.”
Of course, there are no guarantees of even “a modest negative real return” on one’s investment in gold. Gold can go through periods of extreme volatility, like all asset classes. One only has to look at the period from 2008 to 2015, when gold suffered a 34% decline, then delivered a 281% price increase, followed by a sharp 38% retracement, for a total price decline of 31% by the end of 2015. Gold’s volatility can be intimidating for short-term traders and should, for most investors, be considered principally as a long-term portfolio component. Of course, for professional traders, its volatility can make it an excellent tactical trading tool, as well.
A quantitative analysis of the role of gold in investment portfolios
Opinions on the subject of gold as a portfolio component are highly polarized, and it is often difficult to separate hyperbole from facts. We believe it is necessary to fully understand the economic and market drivers that can make gold a valuable constituent of a typical investor’s portfolio.
We will focus this quantitative assessment on a look at how gold has performed relative to other major asset classes since 1973 (the year in which the price of gold was finally unfrozen from its $35 per ounce Great Depression status) under a variety of market and economic conditions. The global and U.S. economies since that time have thrown a multitude of challenging situations at investors, from several energy crises, to the interest-rate spikes of the 1970s, to any number of macro geopolitical situations—including the two great booms and busts of the stock market over the past 15 years.
We have selected 1973 as the starting point for our analysis, as this represents what we believe to be the first “clean” calendar year for gold price performance following the momentous decisions of the Nixon administration in August 1971. Actions taken then effectively ended “ties” to the gold standard for the U.S. dollar and suspended convertibility of the dollar to gold.
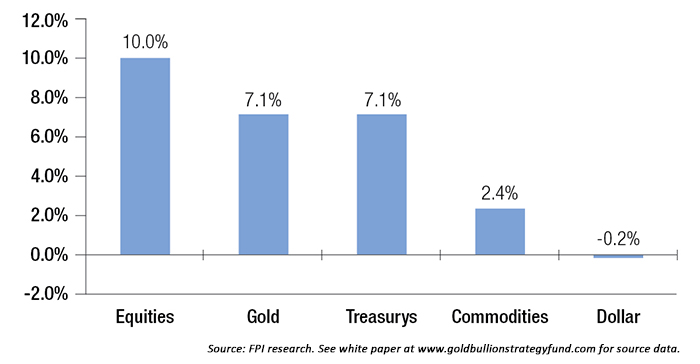
Let’s first look at the annualized rate of return of various asset classes from 1973 to Dec. 31, 2015 (Figure 1).
FIGURE 1: BASELINE—PERFORMANCE OF VARIOUS ASSET CLASSES
Definition: Annualized returns of various asset classes over time.
As shown, equities have been the best-performing asset class throughout this period, followed by gold and Treasury bonds. But equity performance has been far from a “smooth ride” for the past several decades. In contrast, gold’s equally bumpy journey has demonstrated a unique ability to outperform equities in times of equity market stress and also under a variety of different economic conditions.
Let’s examine several of those economic scenarios, again based on historical data from January 1973 to December 2015. We examined the favorable performance of gold relative to other asset classes under seven different conditions:
- Real returns on the 10-year Treasury bond are negative (real interest rates less than zero).
- Equities are in a bear market.
- Commodity prices are in a bull market.
- The U.S. dollar is in a bear market.
- U.S. Treasury bonds are in a bear market (rising-interest-rate environment).
- Inflation is rising.
- Market volatility is high.
Scenario #1: Real rates on Treasury bonds are negative
One of the most important benchmarks for investor returns is the “real” 10-year yield, or the current total return to a 10-year Treasury bond minus the expected rate of inflation. Since the Treasury return is considered virtually “risk-free,” this represents what an investor can reasonably expect to earn on a long-term investment adjusted for changes in currency purchasing power.
Typically, when real yields are positive, equities and bonds tend to perform well as long-term investments. However, the nightmare scenario that keeps pension-fund and other asset managers up at night is when real yields are negative.
Under certain conditions, investors are willing to accept a negative real return in exchange for “safety” and the likelihood that they will recover most of the principal that they invest. This is most common for conservative investors that are near to or currently in retirement.
Negative real rates have been common throughout much of the era that has followed the financial crisis of 2007–2009. This has been a result of the Federal Reserve systematically lowering interest rates to near-zero levels in order to boost the economy. Treasury yields had fallen so far that they were below the rate of inflation for much of 2011 and 2012—indicating that real yields were actually negative.
The question then becomes, “How is an investor going to earn a real return on his or her investments?” This scenario deserves very serious consideration. Real yields have been currently hovering around zero. As it turns out, the great savior in this scenario has historically been gold.
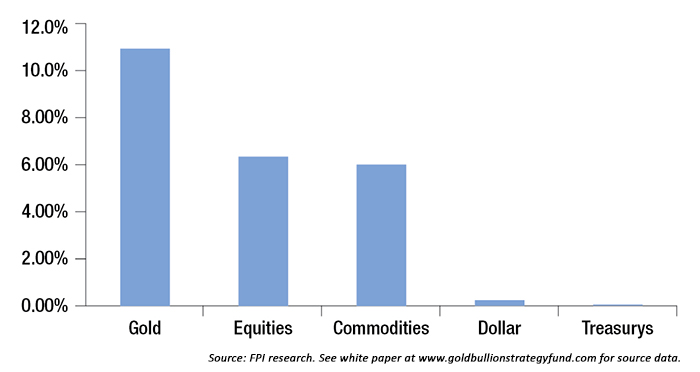
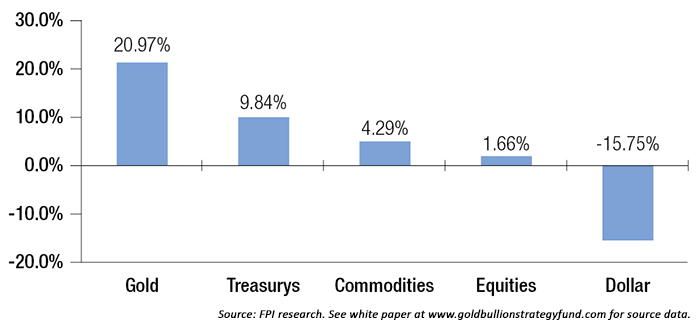
Figure 2 shows the compounded annual return for various asset classes when real 10-year yields are negative.
FIGURE 2: PERFORMANCE OF VARIOUS ASSET CLASSES WHEN REAL RATES ARE NEGATIVE
Definition: When the current total return to a 10-year Treasury bond minus the expected rate of inflation is less than zero.
As shown, gold is the best performing of all major asset classes, delivering nearly 11% annual returns when real Treasury returns are negative, while equities perform at a rate about one-half that of gold. Since 2013, when we first released this paper, real rates have persisted to remain near zero, occasionally moving into negative territory. Additionally, gold has been exceptionally weak. While the general principles and relative performance of each asset class remains the same, the absolute return in gold has decreased. Gold has responded to expectations of inflation and a rise in interest rates by giving back some of the gains it had experienced in the negative-real-rate environment.
Scenario #2: Equities are in a bear market
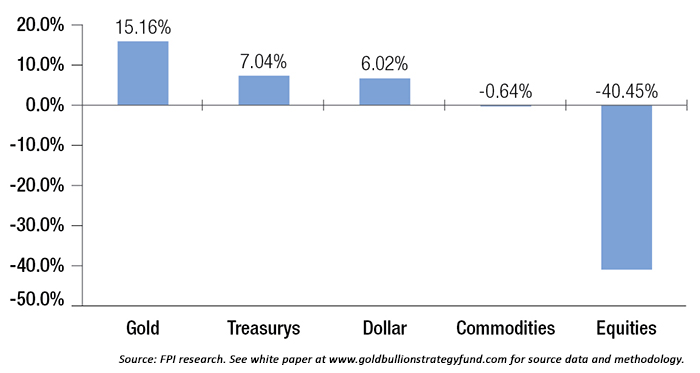
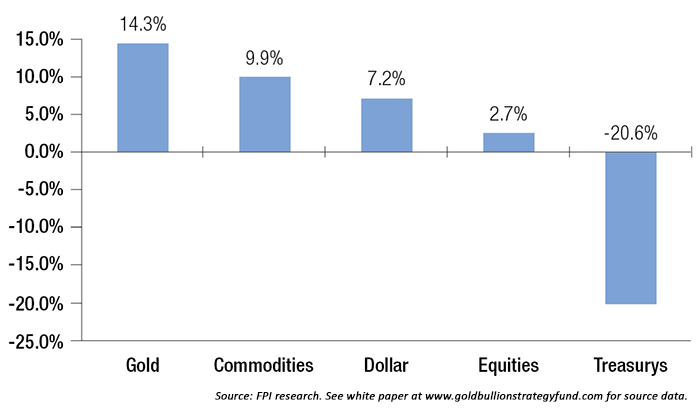
Another benefit attributed to investing in gold is that it provides valuable protection in equity bear markets. It would be reasonable to assume that Treasurys would perform best in equity bear markets, but that has not been the case. Looking across more than 40 years of market history, we identified bull, bear, and sideways markets in the S&P 500 Index, then assessed the returns of alternative asset classes during the bear periods (Figure 3).
FIGURE 3: PERFORMANCE OF VARIOUS ASSET CLASSES IN EQUITY BEAR MARKETS
Definition: Equity bear markets are said to occur when equity prices decrease more than 20%.
Clearly gold has outperformed all other asset classes during periods of equity market stress. Surprisingly, its historical compound return during major stock declines has been higher than the return of Treasurys. This disparity arises because gold offers inflationary protection as well as crisis protection. In addition, because gold has relatively minor demand as an industrial metal, and demand is only partially consumer driven, it tends to have very little economic sensitivity.
The period from Oct. 10, 2007, through March 9, 2009, marked the recent credit crisis, and it was considered a major bear market, lasting 355 days. During this period, the equity market fell 55.2%. In contrast, gold rose 24.6%, more than both Treasurys and the U.S. dollar, which both gained 13.5%. Surprisingly, commodities as an asset class fell in value and did not prove to be a fully defensive allocation.
Scenario #3: Commodities are in a bull market
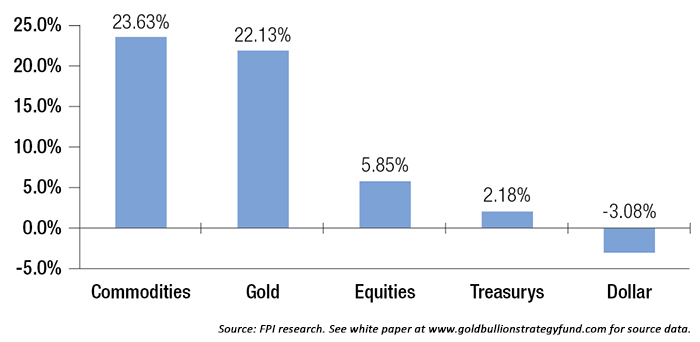
Figure 4 shows the performance of the different asset classes during bull markets in commodities. As you can see, although gold provided positive returns during equity bear markets, while commodities could only muster smaller losses, gold nearly matched the performance of commodities during bull markets in commodities themselves. It thus behaves well on its own and as a useful substitute for broader commodity exposure.
FIGURE 4: PERFORMANCE OF VARIOUS ASSET CLASSES IN COMMODITY BULL MARKETS
Definition: Commodity bull markets are said to occur when commodity prices rise 20%.
One of the significant bull markets in commodities occurred from Aug. 30, 1977, to Feb. 11, 1980. It coincided with President Jimmy Carter’s warning that “the world is running out of oil,” as well as the tensions with Iran and a phased deregulation of oil prices. Commodities rose 61% over that period, while gold soared 386%.
Scenario #4: The U.S. dollar is in a bear market
We have also looked at historical data that shows the U.S. dollar’s value was decreasing relative to a “basket” of foreign currencies (Figure 5).
FIGURE 5: PERFORMANCE OF VARIOUS ASSET CLASSES IN U.S. DOLLAR BEAR MARKETS
Definition: Bear markets for the U.S. dollar are said to occur when prices decrease 10%.
There can be any number of reasons for a dollar bear market, ranging from trade and budget deficits to monetary policy decisions. The data in Figure 5 shows that gold performed extremely well, and significantly outperformed all other asset classes, when the U.S. dollar was falling. Perhaps this is because it is considered to be the currency of last resort by many investors.
For example, the Bretton Woods agreement was a fixed exchange-rate system where the U.S. dollar could be exchanged for gold at a fixed price of $35 per ounce, and other major world currencies had a fixed exchange rate to the dollar. As mentioned earlier, in response to a growing deficit in U.S. gold reserves versus U.S. dollars outstanding, President Nixon decided to break the agreement in 1971. In March 1973, the fixed exchange-rate system officially became a floating exchange-rate system. The U.S. dollar was in a bear market from Jan. 22, 1973, to July 6, 1973, and declined roughly 18% during that time frame. Gold gained 331% over that same time frame, reflecting the increased money supply that was not factored into the price.
Scenario #5: U.S. Treasurys are in a bear market
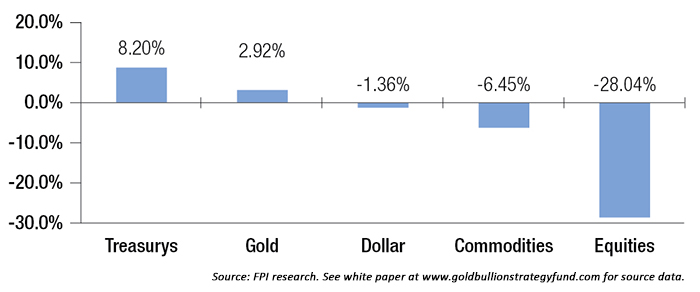
U.S. Treasurys reflect lower prices when interest rates are rising and yields increase. Gold has historically offered the best returns under such a scenario, even outperforming equities, as Figure 6 shows.
FIGURE 6: PERFORMANCE OF VARIOUS ASSET CLASSES IN TREASURY BEAR MARKETS
Definition: Bear markets for U.S. Treasurys are said to occur when Treasury prices decrease 10%.
Since we first published this analysis in 2013, we have experienced Treasury bear markets. The largest effect of these bear markets has been on the performance of equities, which have not fared well in these recent environments. Equities have decreased in compound annual growth rate (CAGR) from 16.2% to 2.7%, largely because these environments do not occur often, and recent performance has been poor. The expectation is that eventually interest rates will need to rise from their current near-zero levels, initiating another Treasury bear market. This highlights the important return and diversification benefits that gold may have in the future if history repeats itself.
Scenario #6: Inflation is rising
Figure 7 shows the historically superior performance of gold when there was a sustained increase in the general level of prices for goods and services. We have defined rising inflation as periods when the one-year rate of change of the Consumer Price Index (CPI) is positive, with causality arising from increased demand chasing too few goods or a rising-cost environment for producers and manufacturers. Within this type of environment, the U.S. dollar clearly weakened, in both “price” and purchasing power, while gold performed well, outperforming a basket of commodities.
FIGURE 7: PERFORMANCE OF VARIOUS ASSET CLASSES WHEN INFLATION IS RISING
Definition: Rolling 12-month rate of change in the CPI is positive.
In 2006, in large part due to rising energy costs, G-7 nations faced the highest level of inflation since the early 1990s. Between January and August 2006, inflation rose 3.6%. In contrast, the price of gold rose 21.5%.
Scenario #7: Market volatility is high
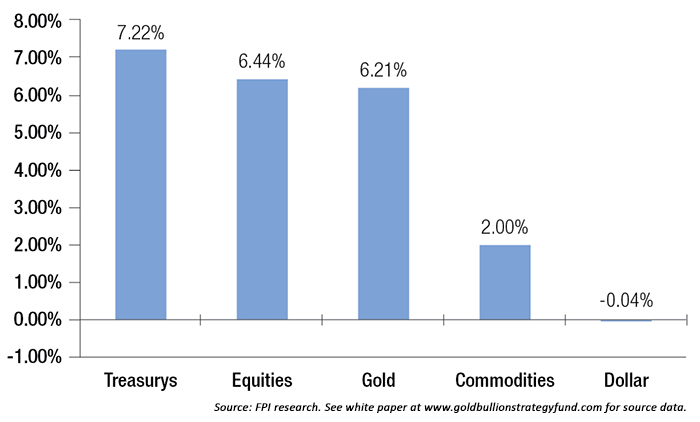
We have defined high volatility as periods when the Implied Volatility Index (VIX) levels were in the top quintile of their 23-year history. As Figure 8 demonstrates, Treasurys performed best when volatility was high, as investors tended to “run for the safety” of preserving principal. But gold also had positive returns, averaging a 2.9% annualized return and serving as a useful “crisis” hedge for investment portfolios.
FIGURE 8: PERFORMANCE OF VARIOUS ASSET CLASSES WHEN VOLATILITY IS HIGH
Definition: The VIX Index is in the top quintile of historical data.
For example, during the Russian financial crisis in August 1998, volatility spiked to high levels starting on August 3 and remained elevated until November 19. In this short period, gold managed to gain 3.5%, while other assets endured a roller-coaster ride. More recently, the extreme levels of volatility seen during the 2007–2009 U.S. credit crisis saw gold sell off dramatically along with most other asset classes. However, it did not fall as far and subsequently recovered much faster, allowing it to exit 2009 at new all-time highs.
Editor’s note: It is clear from the examples given here that gold can provide favorable returns and act as an important counterbalancing portfolio component under a variety of very specific market and economic conditions.
But, how does gold perform under different classic economic regimes?
Part II of “The Role of Gold in Investment Portfolios” will examine this question in some detail. Please see next week’s issue of Proactive Advisor Magazine for this additional discussion and the overall conclusions surrounding optimal allocations to gold in a modern portfolio.
The opinions expressed in this article are those of the author and do not necessarily represent the views of Proactive Advisor Magazine. These opinions are presented for educational purposes only.
This article presents an excerpt of the white paper, “The Role of Gold in Investment Portfolios.” The complete paper—including a list of source data and an appendix on the quantified definition of bull, bear, and sideways markets—can be found at http://www.goldbullionstrategyfund.com.
Past performance does not guarantee future results. Inherent in any investment is the potential for loss as well as profit. A list of all recommendations made within the immediately preceding 12 months is available upon written request.
This white paper is provided for information purposes only and should not be used or construed as an indicator of future performance, an offer to sell, a solicitation of an offer to buy, or a recommendation for any security. Flexible Plan Investments, Ltd., cannot guarantee the suitability or potential value of any particular investment. Information and data set forth herein has been obtained from sources believed to be reliable, but that cannot be guaranteed. Before investing, please read and understand Flexible Plan Investments, Ltd., ADV Part 2A and Part 2A Appendix 1.
The original white paper, published by Flexible Plan Investments in November 2013, was written by David Varadi, David Wismer, and Jerry C. Wagner. The updated white paper, published in April 2016, was revised by Jerry C. Wagner, Jason Teed, and Liangbo Yu.