The S&P 500’s 5.5% gain in Q1 2017 was the best performance since 2015. But this was significantly overshadowed by the NASDAQ Composite’s 9.8% quarterly advance, the best quarter for that index since 2013. The technology sector alone gained about 12%.
The Dow Jones Industrial Average (DJIA) had a remarkable six weeks during February and the first half of March. It rose 5.5%—hitting the 21,000 level on an intraday basis—but faded in March’s second half to end the quarter with an increase of 4.6%.
In looking at equity market winners and losers, several analysts have noted that March saw a partial unwinding of the “Trump trade.” “Investors have been pulling back from banks and infrastructure companies, a reversal of some popular post-election trades,” says The Wall Street Journal.
Barron’s noted, “The market produced those gains without much help from the sectors that surged following the November presidential election—the ones that were supposed to benefit the most from the policies proposed by President Donald J. Trump. … Instead it was the anti-Trump stocks that led the way higher.”
Two indexes that did not fare as well in Q1 are the Dow Jones Transportation Average (+0.8%) and the S&P Small-Cap 600 (+0.7%). Oil service companies, on average, were down 7.6%, while biotechs notched an impressive 16.0% Q1 gain.
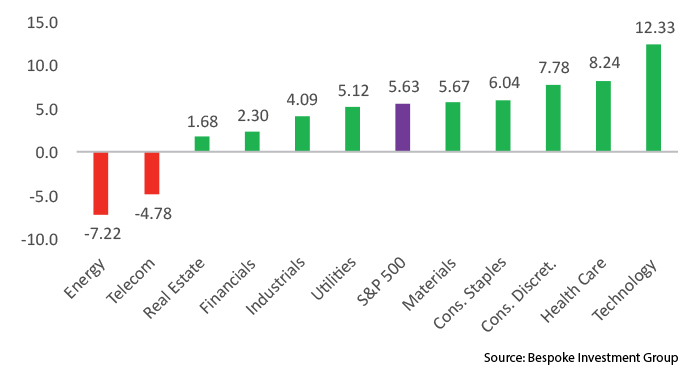
Apple (AAPL) was one of the tech heavyweight stocks leading the Q1 charge for the technology sector (and all three major indexes), up an impressive 24%. As can be seen in Figure 1, technology led all sectors by a significant margin.
FIGURE 1: S&P 500 SECTORS—2017 YTD % CHANGE
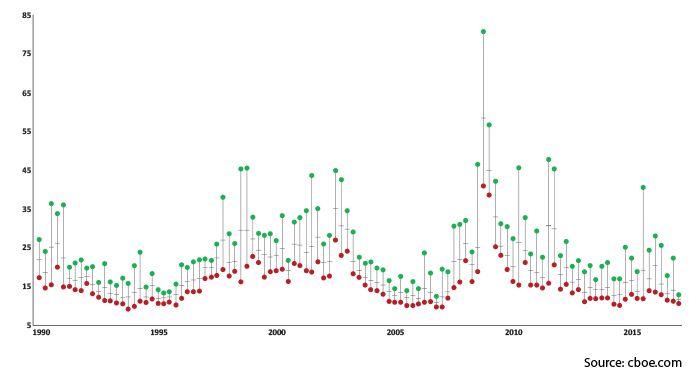
One of the biggest Q1 losers overall, to no one’s surprise, was the CBOE Volatility Index (VIX). The Wall Street Journal wrote this past weekend:
“The CBOE Volatility Index, known as Wall Street’s ‘fear gauge,’ posted its second-lowest quarterly average on record. The average daily percentage change for the Dow Jones Industrial Average during the quarter was the lowest since 1965.”
For the quarter, the VIX was down 11.9%, closing on March 31 at 12.37. The CBOE’s blog contained some interesting commentary on the possibility of seeing more volatile moves in the market, noting,
“The VIX has had a lower average daily close during a quarter only once, the fourth quarter of 2006. However, the low to high range for VIX has never been tighter than what we experienced in the first quarter of 2017, with the range of 2.54. On average, the range of closing VIX prices is about 10.60, so the VIX market may be a bit wound up to the point where a big move to the upside is coming sooner rather than later.”
FIGURE 2: CBOE VIX BY QUARTER (1990–2017)