

According to The Wall Street Journal, major U.S. equity indexes this year suffered “the worst start to a December since 2008.”
While that was hardly good news, recent leading economic indicators for the U.S. have not shown a significant decline, and the earnings outlook for 2019 remains positive. While there is some skepticism from analysts over the quality of earnings for big technology names moving forward, most market observers do not attribute December’s shaky start to the prospects for corporate earnings.
Recent commentaries view investor concerns as being driven by a lengthy combination of factors surrounding trade tensions, Fed interest-rate policy, Brexit’s impact, the behavior of bond yields, potentially weaker global growth, uncertainty surrounding Democratic control of the House of Representatives, and a variety of other issues coming out of Washington.
On the 2019 earnings outlook, FactSet wrote on Dec. 7, 2018,
“For 2019, the bottom-up EPS estimate (which reflects an aggregation of the median EPS estimates for all the companies in the index) is $176.51. If $176.51 is the final number for the year, it will mark a record-high EPS number for the index. However, what is the likelihood that $176.51 will be the final EPS value for the S&P 500 in 2019? How accurate is the bottom-up EPS estimate one year in advance?
“Over the past 20 years (1998–2017), the average difference between the bottom-up EPS estimate at the beginning of the year (December 31) and the final EPS number for that same year has been 8.3%. In other words, industry analysts on average have overestimated the final EPS number by 8.3% one year in advance. …
“However, this 8.3% average includes three years in which there were substantial differences between the bottom-up EPS estimate at the start of the year and the final EPS number: 2001 (+36%), 2008 (+43%), and 2009 (+28%). … If one applies the average overestimation of 3.5% (excluding the years 2001, 2008, and 2009) to the current 2019 EPS estimate, the final value for 2019 would be $170.38. Based on estimates as of today, EPS of $170.38 would reflect a record-high EPS for the S&P 500.”
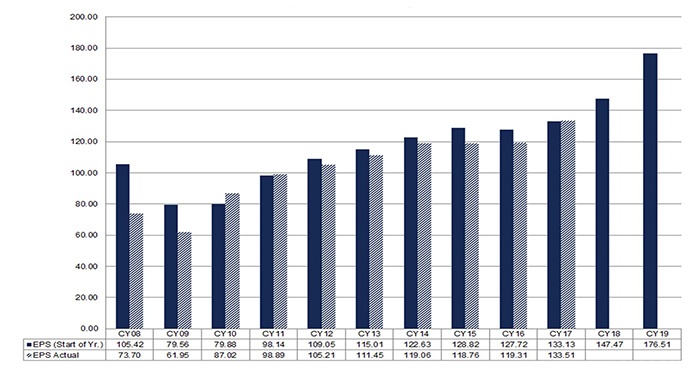
Source: FactSet
“For the fourth quarter (2018), analysts expect companies to report earnings growth of 13.4% and revenue growth of 6.8%. For CY 2018, analysts are projecting companies to report earnings growth of 20.6% and revenue growth of 9.0%. However, analysts expect single-digit earnings growth for the first three quarters of 2019.”
- “For Q1 2019, analysts are projecting earnings growth of 4.8% and revenue growth of 7.0%.
- “For Q2 2019, analysts are projecting earnings growth of 5.4% and revenue growth of 5.7%.
- “For Q3 2019, analysts are projecting earnings growth of 5.5% and revenue growth of 5.4%.
- “For Q4 2019, analysts are projecting earnings growth of 11.8% and revenue growth of 5.8%.
- “For CY 2019, analysts are projecting earnings growth of 8.6% and revenue growth of 5.6%.”
Bespoke Investment Group remarked recently on the state of U.S. economic growth,
Bespoke also points out, however, that the current expansion following the credit crisis—though not a particularly strong one—has at least been notable for its length. That, obviously, is a double-edged sword when analysts are considering the probabilities for recession over the next few years.
Bespoke wrote recently,
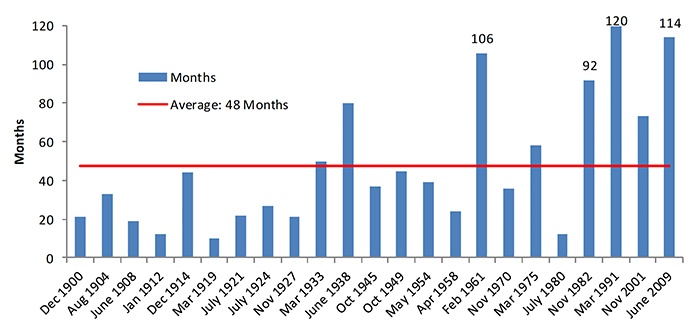
Source: Bespoke Investment Group