No matter what news emerges regarding the Mueller investigation, North Korea, or many other geopolitical or domestic events, the stock market continues to run at full speed.
Last week saw the Dow Jones Industrial Average surpass 24,000 for the first time, just 43 days after hitting the last one-thousand-point milestone (one of the fastest such moves in history, but, of course, each new 1,000-point milestone represents a smaller percentage gain for the Dow).
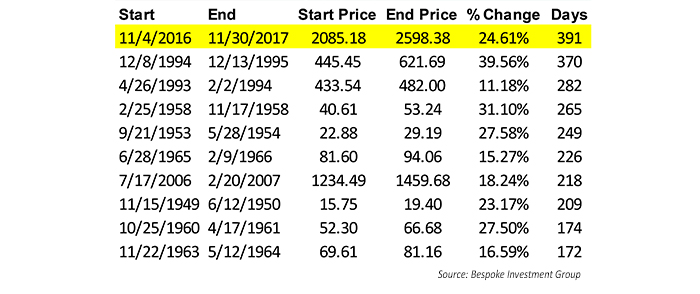
The S&P 500 has now, in the last month, set a record for the longest number of trading days without a 3% correction in a rally that has exceeded gains of at least 3%.
TABLE 1: LONGEST 3%+ RALLIES WITHOUT 3% CORRECTION
What is driving the market in its record-setting run?
The financial press and Wall Street analysts point to several factors:
- “Synchronized” global growth and an improving GDP picture in the United States. Third-quarter GDP growth was revised last week to 3.3%, a three-year high according to Bloomberg.
- Fed interest-rate policy that is seen to remain accommodative under new chairman Jerome Powell, as well as the decision by the ECB to extend quantitative easing at least until September 2018 (albeit at a slower pace).
- Continued optimism over corporate earnings. FactSet projects Q4’s earnings growth rate for the S&P 500 at 10.5%. They say, “All eleven sectors are expected to report earnings growth for the quarter, led by the Energy sector.” But they also note, “The forward 12-month P/E ratio for the S&P 500 is 18.3. This P/E ratio is above the 5-year average (15.8) and above the 10-year average (14.1).”
- The momentum of the market itself. Bespoke Investment Group says the market has had a sustained period of “overbought” conditions, but that this does not necessarily mean the market has to revert to the mean in the short term. Historically, returns over the next one, three, and six months after such a streak ends have been above average for the S&P 500. Bespoke Investment Group co-founder Paul Hickey told CNBC last week, “The fact that we’re overbought by itself doesn’t mean that we’re due for an enormous pullback.” Could the next milestone for the Dow—25,000—be reached at a record pace?
- And then there is the Republican tax plan. The market evidently believes the plan will move relatively quickly through the process of crafting a joint House/Senate piece of legislation, perhaps making it to the president’s desk before Christmas. The prospect of lower corporate taxes—it is argued—is seen to have a long-term stimulative effect for the economy—improving U.S. competitiveness, creating new jobs and higher wages, and encouraging corporations to step up long-term investments.
Of course, there is hardly a consensus on those benefits, especially among Democrats.
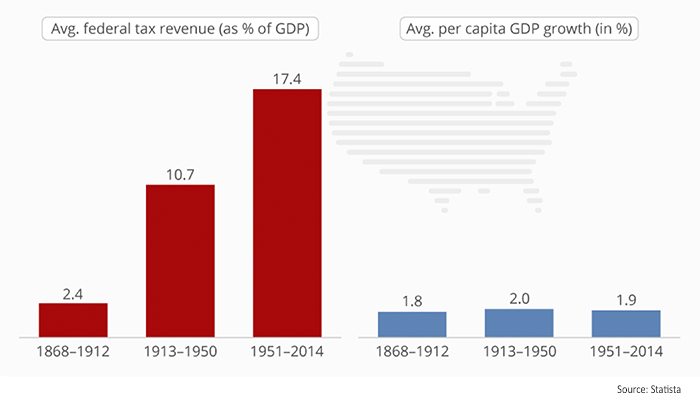
Have overall lower taxes historically had a demonstrative impact on GDP? Broad analysis by research firm Statista raises significant questions on that issue.
Last week Statista wrote,
“You want to boost the economy by lowering taxes? You won’t! You want to dampen the economy by introducing higher taxes? You can’t! Tax policy isn’t a viable tool for steering the economy, one way or the other. The real impact of taxes on the state of the economy is void.
“This is suggested by data compiled by economists Joel Slemrod of the University of Michigan and Jon Bakija of Williams College. ‘There have been huge changes in taxes throughout U.S. history with virtually no observable shift in growth rates,’ economist William G. Gale sums up the findings in an article for the Brookings Institute.
“This calls in to question what President Donald J. Trump is trying to achieve by aiming to lower the overall tax burden. The tax bill currently lingering in Congress, with its stated aim to ignite the economy, therefore is very likely to fail on its objective—if it is enacted in its current or a similar form—and assuming no other changes in tax or spending policy are made.
“The time periods depicted in the chart (Figure 1) are very different eras in terms of tax revenue. From 1868 to 1912, the U. S. had no income tax. From 1913 to 1950 income, estate, and payroll taxes and an expansion of corporate levies were introduced. And by 1950, the U.S. had entered a new period with permanently higher taxes.”
FIGURE 1: FEDERAL TAX REVENUE (AS % GDP) VS. GDP GROWTH