


We often talk about how the stock market usually trends in the opposite direction from volatility ($VIX). But how do we really measure the trend of $VIX? Often, we use the 20-day moving average (MA), but that is a very short-term moving average that changes trend easily. In a longer-term bull or bear market, we would not want to swing in and out of a “core” position when we are trying to stick with the trend.
Accordingly, I looked at the 200-day MA of $VIX. Admittedly, the optimum MA length for determining the trend in $VIX may not be 200 days, but it does show some interesting points. Figure 1 shows $VIX (pink line), $SPX (green line), and the 200-day MA of $VIX (dark blue line), going back to 1993—when $VIX was first listed. Although the definition of $VIX has changed twice since then, this chart shows the value of $VIX at the time in question. (There isn’t a lot of difference between the results of the various calculations—$VXO, $VIXMO, and $VIX.) The $VIX scale is on the left side of the chart, and the $SPX scale is on the right.
The first thing we need to point out about this chart is that $VIX was rising from 1995 to 1999 while the stock market was also rising. This is very unusual and is counter to the assumption that $VIX trends opposite to the stock market. There really isn’t any explanation for this, except to say that the tech stock boom at the time was producing some very volatile moves, and those stocks were generally moving higher and taking the broad market along for the ride. This could certainly happen again in the future, but it would have to arise out of a low-volatility period (like 1993) and would have to coincide with a rising trend in $SPX. Those two conditions have not aligned since.
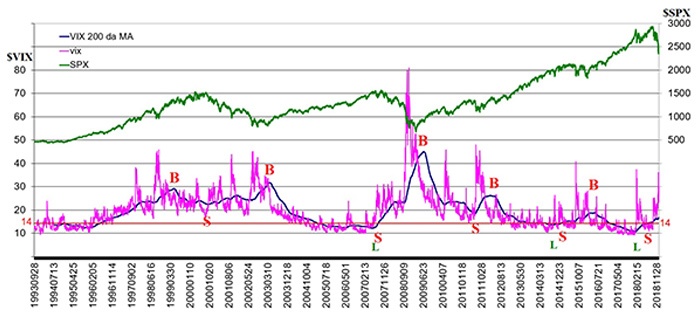
Source: McMillan Analysis Corporation, market data, 1993–2018
Since 1999, $VIX has generally trended opposite to stocks. I’ve marked a few turning points in Figure 1. Places marked “B” are peaks in the 200-day MA of $VIX and would generally be regarded as a buy signal for stocks. Places marked “S” are troughs in the 200-day MA and would be a sell signal for stocks. I have refined the sell signals a bit, since we know that stocks can still rise even if $VIX gets very low and stays there.
So, the sell signals also require $VIX to be above 14 and to have a rising 200-day MA. That’s why there is a horizontal red line at 14 on the $VIX (left) axis. The absolute lows for the 200-day MA in those cases are marked with a green “L.” Selling stocks at these points would not have been terrible, but I prefer to wait until the MA is at least moving above 14 before taking a longer-term bearish stock market position. In 2018, going short at the “L” in early February would have been better—probably missing the first part of that decline, but catching the rest of it, and then suffering through the summer rally. Waiting for the $VIX 200-day moving average to move above 14 last year (2018), you would have gotten short stocks on about July 1—still a bit early.
In general, you can see that you would have been in tune with the major trends in $SPX most of the time by following those simple guidelines as marked on the chart. In reality, the 200-day MA of $VIX “wiggles” from time to time (as does any MA), and it’s hard to discern whether it’s really rolling over or just wavering around the trend. From today’s vantage point, there is no way to tell how one might have reacted in previous bull or bear markets when that happened. But I would suggest that, once your position is in-line with the trend, you should think of reversing only when the change in trend is obvious (perhaps shifting a bit late when the trend actually changes but avoiding getting whipsawed out when the trend only wiggles).
In essence, you would have followed this path:
- Long from May 1999 to October 2000, a modestly bullish move.
- Short from October 2000 to March 2003, catching most of that bear market.
- Long from March 2003 to July 2007, catching most of that bull market.
- Short from July 2007 to July 2009, catching the bear market but overstaying your welcome.
- Long from July 2009 to July 2011, riding a strong bullish wave.
- Short from July 2011 to March 2012, catching the downward move but overstaying at the bottom.
- Long from March 2012 to May 2015, catching another bullish wave.
- Short from May 2015 to April 2016, avoiding the August 2015 and January–February 2016 declines.
- Long from April 2016 to June 2018, riding that last upward move but overstaying a bit.
- Short since July 2018—which was early but is now prescient.
This analysis of trends in volatility isn’t something we would use for timing trades, per se, but as a general guideline whether to be long or short. At the current time, the 200-day MA of $VIX is rising. It only began to rise above 14 last summer. If past bear markets are any guide, it could maintain this trend for some time to come. The 200-day MA of $VIX has typically risen well above 20 in past bear markets, but it is not even up to 17 at the current time.
Finally, it should be noted that a 200-day MA is normally going to overshoot the tops and bottoms—staying short or long the market too long—but it is still a valuable guide.
The opinions expressed in this article are those of the author and do not necessarily represent the views of Proactive Advisor Magazine. These opinions are presented for educational purposes only.
This article was first published at optionstrategist.com on Jan. 4, 2019.
 Professional trader Lawrence G. McMillan is perhaps best known as the author of “Options as a Strategic Investment,” the best-selling work on stock and index options strategies, which has sold over 350,000 copies. An active trader of his own account, he also manages option-oriented accounts for clients. As president of McMillan Analysis Corporation, he edits and does research for the firm’s newsletter publications. optionstrategist.com