
When ‘defense’ can be your best portfolio defense
When ‘defense’ can be your best portfolio defense

A different look at managing portfolio risk: What is the role of defense stocks when global tensions escalate?
Managing a portfolio is equal parts getting the best return and keeping risk to a minimum. For traditional investment portfolios, that usually means balancing equities with bonds—with gold, currencies, and energy often used in complementary roles.
But for portfolio managers and financial advisors who embrace active investment management, there are many additional tools for managing risk, including the following:
- Constructing portfolios that use a wide variety of asset classes with relatively lower correlation to one another, combined with strategies that might vary greatly during different market conditions (e.g., trend-following versus mean-reverting strategies).
- Managing the degree of equity market exposure as conditions change.
- Using hedging techniques, which might include options and managed futures.
- Going inverse to the market or a specific asset class as indicators signal a downturn.
- Rotating from underperforming sectors to overperforming sectors or from more aggressive sectors to defensive sectors, or the reverse.
One factor that is often overlooked is geopolitical risk, where a portfolio can suffer losses because of political change/instability or the threat of war or military conflict. Given the history of the world, it’s difficult to find a time when conflict wasn’t happening somewhere. For investors, beyond safety and fundamental humanitarian concerns, this type of conflict is most important when it involves countries that are being invested in or that impact an entire asset class or a critical trade issue.
The arms race was an example during the Cold War, when the U.S. and former USSR were rushing to see who could develop the most nuclear bombs, far more than needed to destroy everyone on the planet. But then, no one said an arms race needed to be rational. Many of us who were children at that time obviously didn’t look at the Cold War through the eyes of an investor—it’s more likely we were practicing hiding under desks or going to a fallout shelter underground.
FIGURE 1: NUCLEAR WARHEAD STOCKPILES FOR UNITED STATES AND USSR/RUSSIA
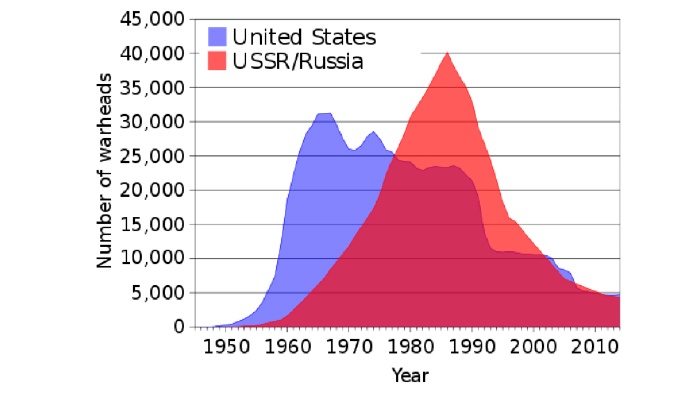
Source: Wikipedia
How important is geopolitical risk now?
War has been around a long time, and it doesn’t seem to be going away. Table 1 lists the conflicts in which the U.S. has played a role since 2001. Of course, that does not include potential conflicts, or conflicts that have not risen to some level of combat. Those are shown in Table 2. The picture should be clear. War—and the threat of war—is ongoing.
TABLE 1: SIGNIFICANT ARMED CONFLICTS INVOLVING THE U.S. SINCE 2001
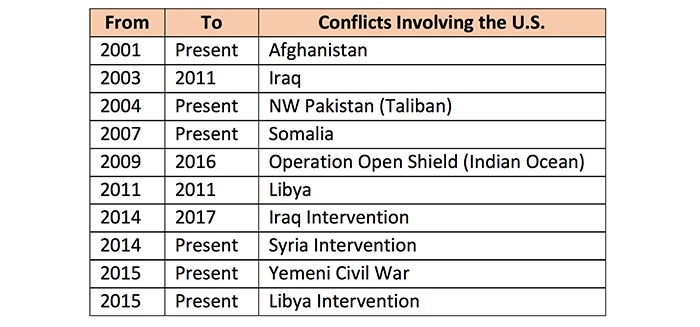
Source: Adapted from Wikipedia time line of U.S. military operations,
based on information from the U.S. House Committee on Foreign Affairs
TABLE 2: CURRENT POLITICAL CRISES THAT MAY LEAD TO ARMED CONFLICT
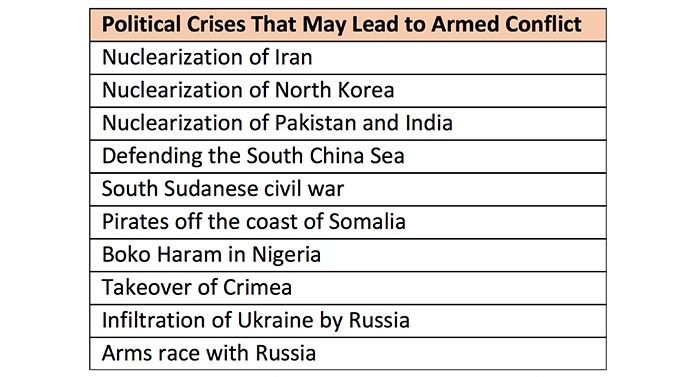
Source: Adapted from Wikipedia time line of U.S. military operations,
based on information from the U.S. House Committee on Foreign Affairs
Is there a role in your portfolio for defense stocks?
Defense stocks move with geopolitical anxiety, if not outright conflict, which is very different from concerns over economic downturns or recession. We know that true diversification reduces risk and helps stabilize returns. Three of the more popular defense stocks are Lockheed Martin (LMT), Northrop Grumman (NOC), and Raytheon (RTN). Boeing (BA) can also be included here, but it has a large commercial business, which makes it more of a hybrid entry. There are also several ETFs available, including the following:
- iShares US Aerospace & Defense ETF (ITA), started 5/5/2006.
- SPDR S&P Aerospace & Defense ETF (XAR), started 9/29/2011.
- PowerShares Aerospace & Defense ETF (PPA), started 10/25/2005.
- Direxion Daily Aerospace & Def Bull 3X ETF (DFEN), started 5/3/2017.
Plotting the performance of three ETFs (ITA, XAR, and PPA) against the S&P 500 ETF (SPY) will show the long-term returns of both. Figure 2 sets the three “defense” ETFs and SPY to a starting indexed value of 100 on 1/31/2012 to make it easier to compare them. The result seen in Figure 2 is that the defense ETFs performed better than SPY over the past six years, which has been a period with several real and potential geopolitical threats affecting the U.S.
FIGURE 2: COMPARING DEFENSE ETFS TO SPY (2012–2018)
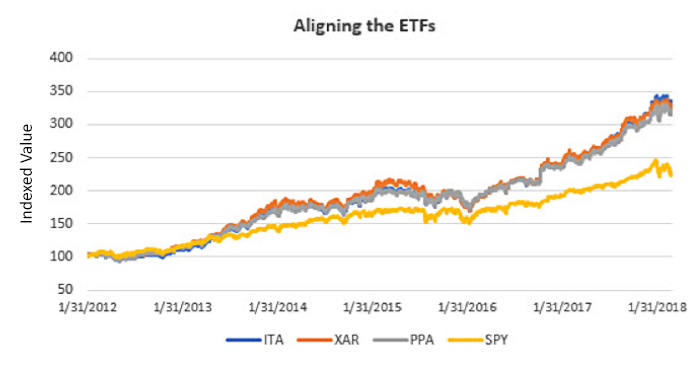
Source: Market data
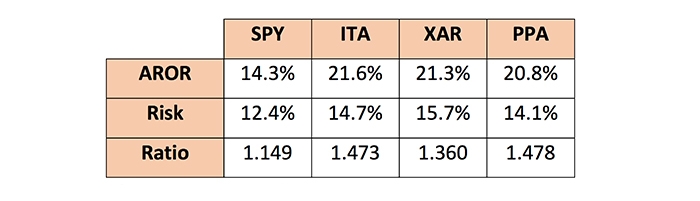
Table 3 shows the annualized rate of return (AROR), the volatility (Risk), and the ratio of the return to volatility (Ratio), a good comparative measure of performance. All three defense ETFs have similar returns and risk, with the returns far exceeding SPY during the sustained bull market. Most important, the ratios show they also have relatively lower risk, a very desirable feature.
Given the better ratios, including defense ETFs or defense stocks might improve overall performance for a portfolio during periods when there are heightened concerns over geopolitical risk.
TABLE 3: RETURNS AND RISK OF DEFENSE ETFS VERSUS SPY (1/2012–1/2018)
Source: Analysis of market data
But this isn’t about trading defense stocks instead of other possible portfolio selections, or the equity indexes. It’s about using the defense stocks to enhance existing portfolios and mitigate risk in times of crisis or geopolitical tension. If tensions increase, the benefit of exposure to defense stocks should also increase.
Defense stocks tend to move together during a crisis
To understand why using defense stocks or ETFs could be important, we only need to look at some of the past crises and the market reaction. But because the defense ETFs don’t go back very far, the combined returns of Boeing (BA), Lockheed Martin (LMT), Northrop Grumman (NOC), and Raytheon (RTN) are used instead in some examples to follow. The correlation between the average price of the four stocks and the ITA ETF is 0.83. These four stocks represent approximately 30% of the weighting in the ITA ETF and exert a significant influence on its price and direction, especially during times of geopolitical risk.
Can the defense sector help mitigate both geopolitical and overall market risk?
A good way to understand the benefits of hedging a portfolio with bonds is to compare their performance during times of major market stress over the past several decades. These include the crash of 1987, the end of the dot-com bubble and subsequent market decline, and the 2007–2009 financial crisis.
Bonds did a reasonable job of diversification, providing something of a “safe haven” for investors and mitigating overall portfolio risk whenever the crisis was primarily economic in nature. Of course, with a traditional 60/40 allocation of stocks to bonds in a passive portfolio, investors still likely saw significant and painful losses.
How did defense stocks perform during a recent period of market risk that was more driven by geopolitical issues and the threat of armed conflict than economic uncertainty? For that, we can look at the period of June 2017 to December 2017, when the rhetoric between North Korea and the current administration started to heat up, not to mention continued serious issues in the Middle East.
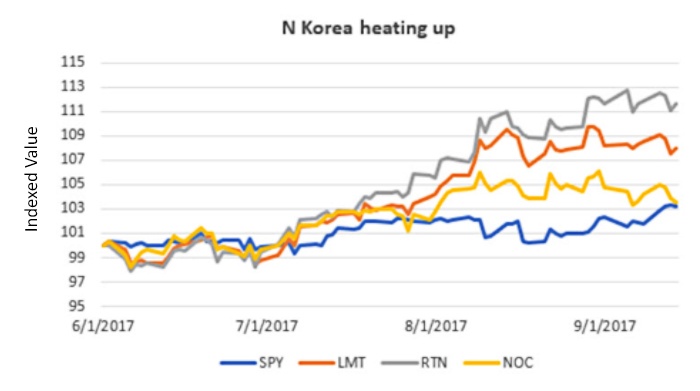
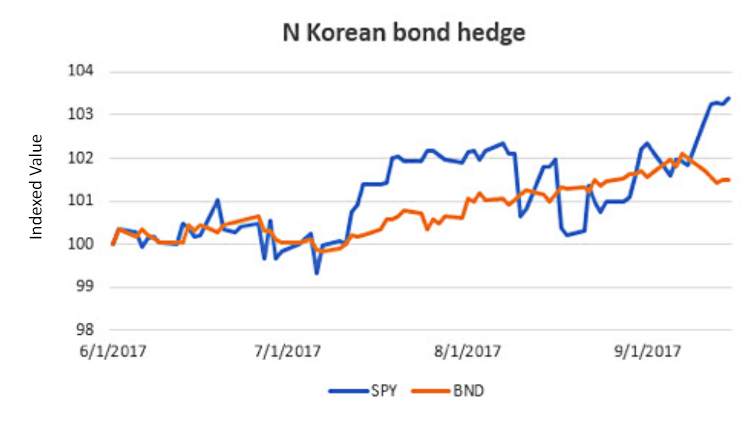
Defense stocks seemed to have anticipated the escalating rhetoric between the U.S. and North Korea in mid-2017. Figure 3 shows that the movement of three defense stocks ranged from +3% to +12%, compared to +3% for SPY. Figure 4 shows that bonds (using the Vanguard total bond market ETF BND) gained about 1.5% during this period, far lower than these defense stocks.
FIGURE 3: DEFENSE STOCKS REACT TO HEIGHTENED TENSION WITH NORTH KOREA
Source: Market data
FIGURE 4: BOND PERFORMANCE DURING NORTH KOREA TENSIONS
Source: Market data
The Iraq War
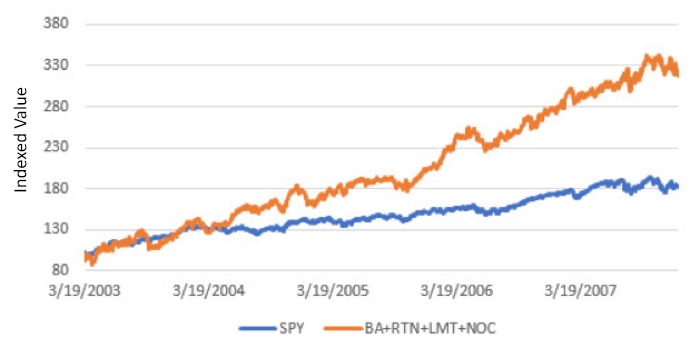
To understand the longer-term effect of conflict on defense stocks, we can also look at the Iraq War. This conflict started on March 20, 2003, and witnessed a key milestone with the troop surge in 2007 (before continuing in various scales to the present day). Using the combination of BA, LMT, NOC, and RTN, Figure 5 shows the steady gain of defense stocks compared to the overall market. As the SPY gained 81%, these defense stocks gained 217%.
The fundamental explanation for this outperformance is the money thrown at defense during this period, a large part of which went directly to these primary defense contractors, among many others.
FIGURE 5: DEFENSE STOCKS VERSUS SPY DURING THE IRAQ WAR (2003–2007)
Source: Market data
Times change and risks change
The combination of the S&P 500 and bonds continues to serve investors well as a conservative portfolio. During a financial crisis or swings in the U.S. dollar, bonds have generally mediated losses in the stock market. Professional managers will reduce portfolio risk exposure by increasing bond holdings versus equities. During periods of strong economic activity and low volatility, they will shift back to equities.
But times have changed, and all risks are not the same. Economic risk requires protection in bonds, currency risk requires the U.S. dollar or gold, and geopolitical risk requires (in my opinion) defense stocks. Terrorism and geopolitical threats have become too common. How much then should an active manager allocate to a defense ETF to help protect and improve a client’s portfolio? Any amount would be an improvement, but 20% would likely be the greatest allocation. Even a small allocation will reduce total portfolio risk. To provide an illustration, an allocation of 60% stocks and 40% bonds would become 48% stocks, 32% bonds, and 20% defense stocks. Figure 6 shows the returns of a stock and an investment-grade corporate-bond allocation (represented by the ETF LQD) for a 15-year period from 2005 to 2017, and Figure 7 adds defense stocks.
FIGURE 6: RETURN CURVE OF STOCK AND BOND ‘TRADITIONAL’ ALLOCATION
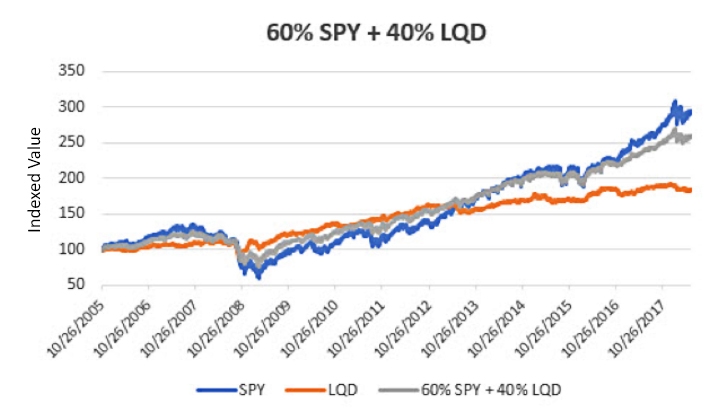
Source: Market data
FIGURE 7: ‘TRADITIONAL’ PORTFOLIO VS. TRADITIONAL PLUS DEFENSE
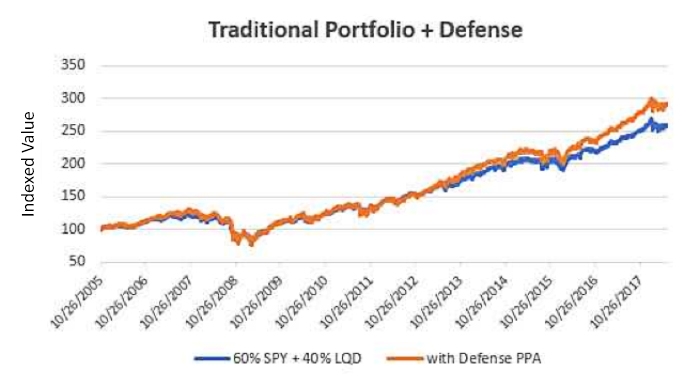
Source: Market data
By the numbers
It is difficult to distinguish one return curve from the other in Figure 7. A measure of the returns and risk of these combinations make the results clearer. Table 4 shows the annualized return (AROR), annualized volatility (Risk), and the ratio of AROR to risk (Ratio), a good measure of ranking. As expected, bonds have a lower return and much lower risk than SPY, and the defense ETF PPA has the same ratio as bonds but much higher returns and risk. But the portfolio with stocks, bonds, and defense stocks (on the far right) has slightly lower returns but far lower risk, making the ratio nearly twice that of SPY alone.
TABLE 4: RISK AND RETURN COMPARISON OF PORTFOLIO ELEMENTS AND COMBINATIONS
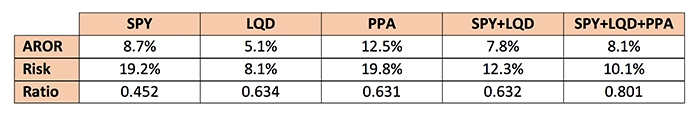
Source: Analysis of market data
If we look at the most recent period, from the beginning of 2018, and compare SPY with the average of the three defense ETFs, the first area highlighted in Figure 8 shows that the drawdown in defense ETFs is less than the SPY drawdown. The second shaded area captures the optimistic resolution of the Korean tension, which quickly reversed.
FIGURE 8: COMPARATIVE DRAWDOWNS OF DEFENSE ETFS VS. SPY (2018)
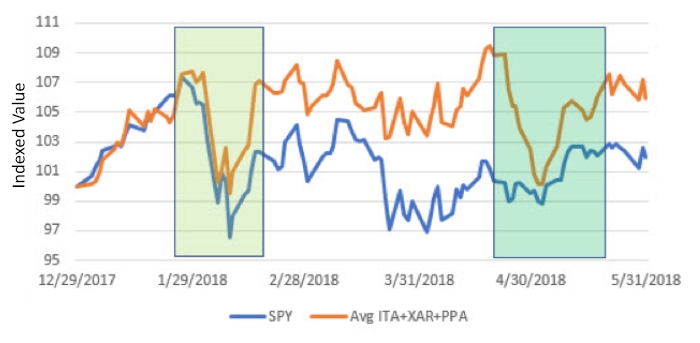
Source: Market data
When combined into a portfolio, stocks and bonds have the same ratio as bonds but with a return closer to the SPY returns. However, when the defense ETF PPA is added, the returns increase, the risk drops, and the ratio improves by more than 25%. We may not be able to foresee the future, but adding protection from geopolitical risk, without lowering performance, seems like a good “defensive” game plan.
The opinions expressed in this article are those of the author and do not necessarily represent the views of Proactive Advisor Magazine. These opinions are presented for educational purposes only.
 Perry Kaufman is a financial engineer specializing in algorithmic trading. He is best known for his book, “Trading Systems and Methods,” (fifth edition, Wiley, 2013) and recently published “A Guide to Creating a Successful Algorithmic Trading Strategy” (Wiley, 2016). Mr. Kaufman has a broad background in equities and commodities, global macro trading, and risk management. Find more information at his website: www.kaufmansignals.com
Recent Posts: