

The big question that stock market analysts are asking themselves lately is what it means to have crude oil prices drop below $50. The more proper question is, “What does the drop in crude oil prices now mean for the stock market 10 years from now?”
One of the the most fascinating intermarket relationships ever uncovered is the one between stock prices and crude oil prices. The core principle that kept so many from seeing it involves the delayed reaction. The movements of stock prices tend to echo the movements of crude oil prices, albeit with a 10-year lag.
I first uncovered this when I gathered the data for a long-term view of crude oil prices. I realized when looking at that chart that I was seeing a facsimile of the pattern in the DJIA—but the two did not align properly. I found that by shifting the oil price plot forward by 10 years, I got a much better alignment of the price patterns.
This was a big revelation! The automobile boom in the 1910s led to a big oil price spike toward a 1920 top, which led to the overly speculative Texas oil boom of the 1920s. That March 1920 oil price top had its echo just under 10 years later with the September 1929 stock market top. The flat period for oil prices of the 1950s and 1960s was replicated by seeing stock prices move sideways from 1966-1992. There are multiple other points of similarity in their histories.
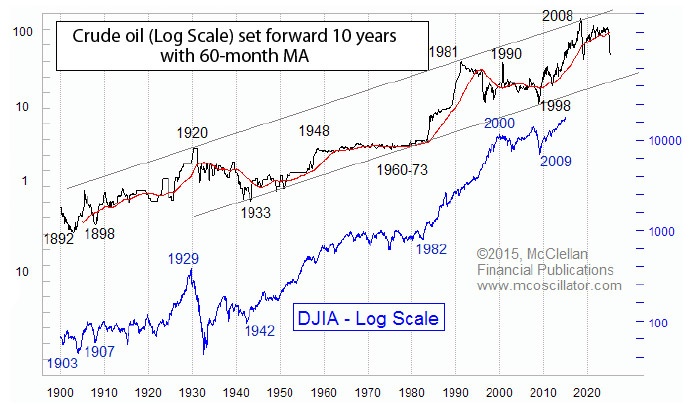
The relationship got into a little bit of trouble when the Arab Oil Embargo put a thumb on the scale starting in 1973. And the Iranian revolution in 1979 perturbed it further. But once the oil market returned to a normal fluctuating balance of supply and demand in the mid-1980s, the relationship trued itself.
A November 1998 bottom for crude oil prices had its echo with the March 2009 stock market bottom. And the rebound in oil prices from that 1998 low to the speculative commodity bubble top is now having its own replication in the form of stock prices undergoing a fairly linear uptrend lasting longer than most bull markets. Some credit the Fed and QE, but crude oil knew about it even before the financial crisis and subsequent policy response.
What this means for money managers
One of the most helpful insights for trading is to know whether one is in a trending market or a corrective trading-range market. The message from oil prices 10 years ago is that we should see a continued equity uptrend until we get to the inflection point that is the echo of the speculative commodity bubble top in 2008, which should be due to arrive in 2018. The difficult point to ascertain is how much credence to give to that 2008 event, as there have been those prior exogenous forces acting on the oil market in the past that did not see a precise echo in the stock market.
I do not know if we will see a precise replica of the 2008-2009 oil price decline in 2018, but the period from 2018-2025 should be one of those periods when market timers rule. The big drop in oil prices during late 2014 should have its echo in stock prices during 2024. That will be an ugly time for stock market participants, but we have some time to prepare for that drop as well. Right now, we have three more years of an uptrend to harvest, which is the more important task to focus on.
The opinions expressed in this article are those of the author and do not necessarily represent the views of Proactive Advisor Magazine. These opinions are presented for educational purposes only.
 Tom McClellan is the editor of The McClellan Market Report newsletter and its companion, Daily Edition. He started that publication in 1995 with his father Sherman McClellan, the co-creator of the McClellan Oscillator, and Tom still has the privilege of working with his father. Tom is a 1982 graduate of West Point, and served 11 years as an Army helicopter pilot before moving to his current career. Tom was named by Timer Digest as the #1 Long-Term Stock Market Timer for both 2011 and 2012. mcoscillator.com
Recent Posts: