


Editor’s note: Tony Dwyer, U.S. portfolio strategist for Canaccord Genuity, and his colleagues author a widely respected monthly overview of market conditions, technical factors, and future market outlook called the “Strategy Picture Book.” The following provides an excerpt from their Oct. 9, 2018, report on the macro market outlook.
Many factors that typically precede a credit-led recession are not present
The recent rise in the U.S. Treasury 10-year bond yield above 3.23% has many trying to figure out the elusive “level” of interest rates that would cause a shutdown of credit and recession, but we believe it is much more useful to identify indicators that offer a guide to when it might be approaching:
- Inversion of the yield curve (YC). As we have highlighted over recent years, the best indicator for an ultimate recession over the past seven cycles is an inversion of the yield curve. If you look at periods of relatively benign inflation (1960s, 1980s, 1990s, 2000s), the median lead time to recession is 31 months (Figure 1). Recessions start a median of 19 months after the initial U.S. Treasury 2-year/10-year yield-curve inversion, and the yield curve has actually been steepening recently.
FIGURE 1: INTEREST RATE OUTLOOK
Flattening curve still not pointing to recession
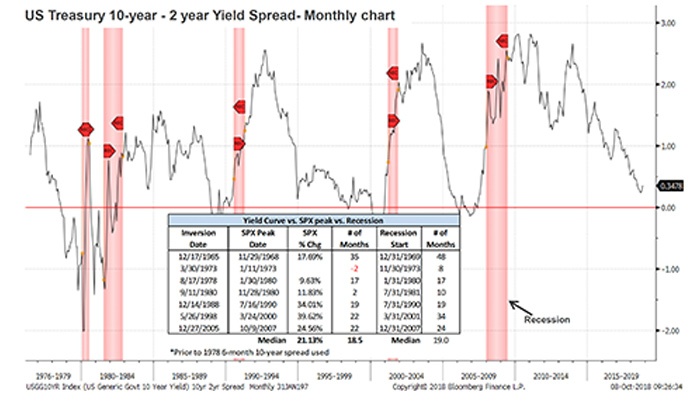
Sources: Source: Bloomberg, Canaccord Genuity
- Fed senior loan officer survey. Each quarter, the Fed asks the banks whether they are “tightening” or “easing” their lending standards. In the most recent survey, they found that despite one of the longest economic expansions in history, banks have eased their lending standards to both small and large businesses (Figure 2), helping fuel capital expenditures (CAPEX).
FIGURE 2: CAPEX HELPED BY EASIER BANK LENDING PRACTICES
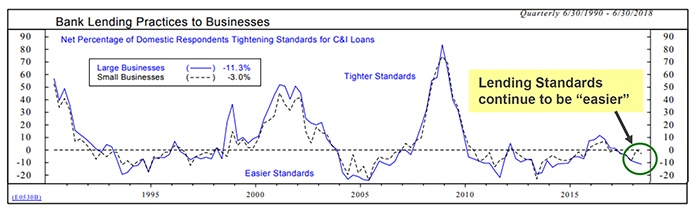
Sources: Canaccord Genuity, ndr.com
- Small-business confidence. The NFIB Small Business Optimism Index (NFIB), which is likely the broadest measure of sentiment among small-business owners, recently made a new cycle and record high (Figure 3). This driver of the U.S. economy and employment has shown significant improvement following the 2016 election and has stayed that way given the fiscal stimulus of deregulation and tax cuts. We found that a peak historically leads recession by a median of 41 months—something to consider if August 2018 proves to be the cycle peak.
FIGURE 3: SMALL-BUSINESS OPTIMISM AT RECORD HIGH
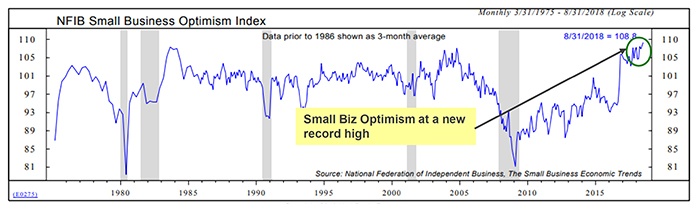
Sources: Canaccord Genuity, ndr.com
- Manufacturing optimism. The ISM Manufacturing Survey (ISM) has measured sentiment at the manufacturing level since 1950, and August hit a cycle high (Figure 4). We have found that a cycle peak in the ISM leads recession by 31.5 months.
FIGURE 4: MANUFACTURING STILL SEEING POSITIVE OUTLOOK
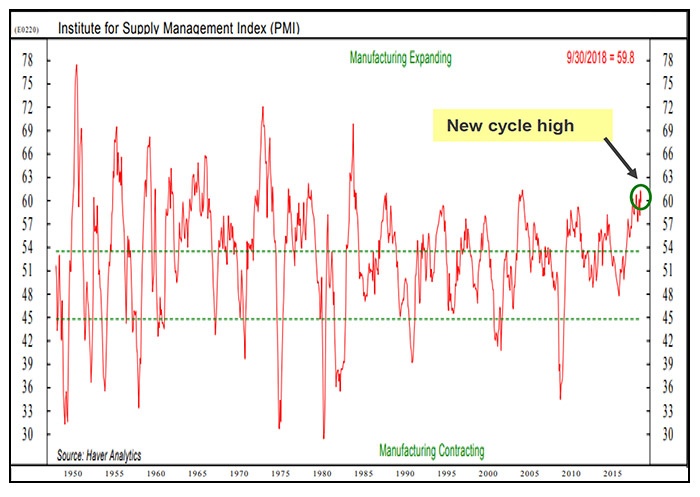
Sources: Haver Analytics, Canaccord Genuity, ndr.com
- National financial condition indexes. The Chicago Fed has three indexes (risk, credit, and leverage) that compile 105 stress indicators within traditional banking, shadow banking, and the financial markets. Stress happens fast, but not before these factors play out. Over the past 40-plus years, the indexes have been above zero before a recession. All of the indexes are still near historically low stress levels.
It is too early to suggest the market correction is over
A positive fundamental backdrop can be interrupted with temporary periods of volatility, and we are partially through one now. We expect further near-term volatility until our four key tactical indicators approach levels that are typically reached near the beginning of the next intermediate-term leg higher. The first signs of an identifiable bottom are a VIX approaching 20 (currently 15), and the percentage of S&P 500 (SPX) components trading above their 10-day moving average dropping below 20% (currently at 33%).
Our core positive fundamental thesis remains in place
We continue to believe the strength in EPS, coupled with strong business and consumer confidence, should cause any market weakness to prove temporary until there is an identifiable recession in sight. Sustainably negative economic periods don’t magically materialize because rates are going up; they are driven by credit stress that leads to a credit crisis strong enough to shut down money availability. History shows this happens more slowly than many believe, as proven by the lead time to recession of the initial inversion of the U.S. Treasury 2-year/10-year yield curve, and the cycle highs of the NFIB Small Business Optimism and ISM Manufacturing surveys.
The opinions expressed in this article are those of the author and do not necessarily represent the views of Proactive Advisor Magazine. These opinions are presented for educational purposes only.
 Tony Dwyer is the head of the U.S. Macro Group and chief market strategist at Canaccord Genuity. He also sits on the firm’s U.S. operating committee. Mr. Dwyer joined Canaccord Genuity in 2012 and is known for the practical application of macroeconomic and tactical market indicators. Mr. Dwyer was previously equity strategist and director of research at Collins Stewart and a member of the firm's executive committee. Mr. Dwyer is a frequent guest on many financial news networks. canaccordgenuity.com
Recent Posts: