
A more efficient (and profitable) frontier
A more efficient (and profitable) frontier

Why active management makes optimal portfolios easier to create
The idea behind the efficient frontier serves a critical role in portfolio construction, enabling a risk-based, diversified approach to determine where to invest our clients’ (and our own) money. But textbook methods for generating the efficient frontier rely on a few “pesky” assumptions to achieve the type of consistency Dr. Kahneman mentions. However, since a Nobel Prize winner came up with the frontier, we can just ignore those assumptions, right? Unfortunately, the answer is a resounding no. Here’s why.
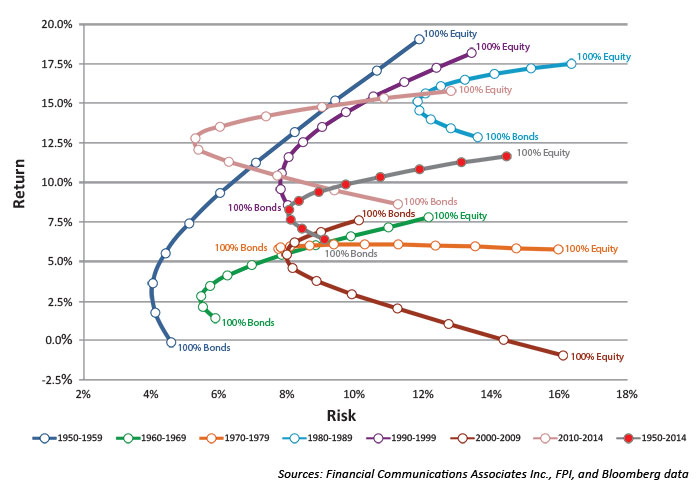
Expected returns are a critical input to build an efficient frontier. Put another way, the frontier counts on our ability to credibly predict asset-class returns. But is that realistic? In her article “The Efficient Frontier Fails the Test of Time,” Linda Ferentchak showed how inconsistent asset returns can be, even over relatively long periods. The impact on the optimal portfolio is profound. Accounting for changing asset returns, Figure 1 shows that the efficient frontier was wildly different for every 10-year period from 1950 to 2009 (and this inconsistency persisted from 2010 to 2014). What that means is using any period of historical asset-class returns to create an optimal portfolio for the following 10 or 20 years is, at best, unreliable.
FIGURE 1: THE INEFFICIENT FRONTIER
Another problematic assumption is that we can rely on relatively consistent correlations between asset classes. Frontier calculations require a covariance matrix (which is used to show how variables change together) for all asset classes involved. Relatively minor changes to the matrix can have a big impact on the frontier. A correlation, which is a normalized way to view covariance, summarizes the strength and direction of a relationship between two variables (e.g., returns of two different asset classes like stocks and bonds) over a certain period of time. Correlations range from +1.0 (perfect movement in the same direction) to -1.0 (perfect movement in opposite directions). Real-world asset-class correlations are rarely perfect, and that’s fine; the problem, as shown in Figure 2, is that correlations for the bellwether asset classes are wildly inconsistent over time.
FIGURE 2: STOCK AND BOND CORRELATIONS CHANGE OVER TIME
Correlation of changes in 10-year government bond yields and S&P 500
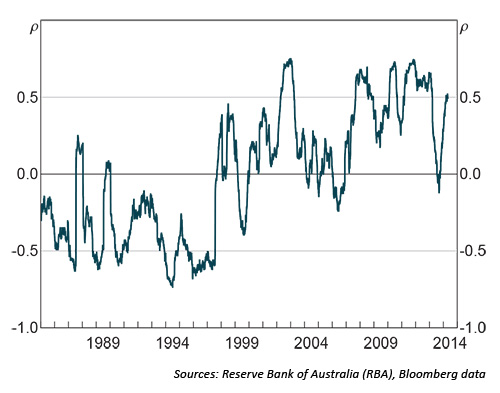
Six-month rolling centered correlation of daily changes
Figure 2 shows how correlations fluctuate between the S&P 500 and 10-year U.S. government bond yields from 1985 to 2015, and Table 1 summarizes the data.
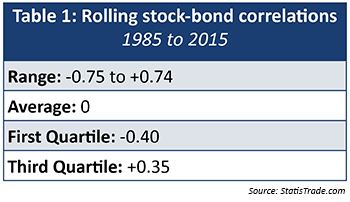 There are a few critical points to take away from the graphic and table. First, the table shows correlations that range from -0.75 (S&P 500 and 10-year bonds generally moved in opposite directions) to +0.74 (S&P and 10-year bonds generally moved in the same direction). That’s an enormous range. In most industries, correlations that gyrate this wildly would be considered useless. Yet, these correlations are critical inputs to determine the efficient frontier.
Building an efficient frontier counts on our ability to credibly predict asset-class returns. Is this realistic?
Second, looking at Figure 2, you can see a significant shift over time. From 1985 to 1997, stocks and bonds tended to move in opposite directions. But from 1997 to 2015, it was far more common for the two asset classes to move in the same direction. This type of seismic change in market relationships is yet another reason why we need to be careful about how we go about trying to achieve the potential benefits of modern portfolio theory.
Finally, you might have noticed the average correlation over the entire period is zero. Think about that for a second. We use averages as the starting point for building portfolios most of the time. Looking at the wild fluctuations here is an excellent reminder why averages can be so misleading, especially when the individual data points vary significantly.
A related concern is what happens to correlations in a crisis. In other words, we use historical correlations to help build a diversified portfolio. And a key idea behind a diversified portfolio is while some asset classes are going down, others are going up. But does this hold true in a crisis? Any advisor who lived through 2008 with a traditionally diversified portfolio (e.g., value stocks, growth stocks, large-cap stocks, international stocks, and bonds) can tell you that asset classes often become highly correlated in a crisis.
FIGURE 3: CORRELATIONS SPIKE DURING A CRISIS
Correlations between select market segments and traditional asset classes
(Oct. 2007–Feb. 2009)
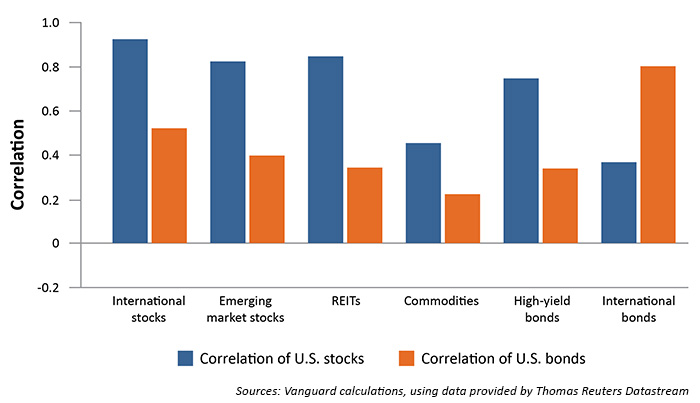
An April 2012 research report published by Vanguard provides an example. From 1988 to 2011, the correlation between international bonds and U.S. bonds was about +0.4. As shown in Figure 3, from October 2007 to February 2009, that correlation spiked to +0.8, a 100% increase. Many other asset classes showed similar correlation increases. The result? Fund managers, advisors, and clients relying on the longer-term correlations to support their portfolios during the 2008 crisis were disappointed.
The ideas behind the efficient frontier are sound, but we’ve seen that two key inputs are extremely unreliable. So how can we more effectively build a portfolio designed to balance risk and reward? The key is to achieve true diversification, and there are several ways to get there.
First, we can diversify into more asset classes with low correlations to stocks and bonds. Commodities, an asset class many passively focused advisors overlook, have provided attractive long-term correlations with stocks and bonds, and they also maintained relatively low correlations during the 2008 crisis.
Second, we can diversify into active management strategies. But active management strategies aren’t an asset class, right? No, but they can still transform an underdiversified portfolio. For example, studies by both academics and fund managers have shown that active strategies based on momentum and value can provide market-beating returns with less volatility than passive approaches. Some of those strategies also have low, or even negative, correlation to stocks, making them an outstanding way to diversify.
When the media discusses active management strategies, they typically focus on management fees and how actively managed mutual funds perform versus passively managed mutual funds. But they overlook two critical benefits of active strategies often used in separately managed accounts that take a more holistic portfolio approach: diversification and lower volatility. Everyone knows the benefits of diversification. And achieving lower volatility can help mitigate the wild fluctuations in correlations we saw above, making the frontier calculations more reliable. Now is the time advisors should expand their views and understand diversification isn’t just about asset classes. Dedicating a portion of client assets to proven actively managed strategies is an effective way to diversify and build less volatile client portfolios.
The opinions expressed in this article are those of the author and do not necessarily represent the views of Proactive Advisor Magazine. These opinions are presented for educational purposes only.
This article first published in Proactive Advisor Magazine on May 11, 2016, Volume 10, Issue 5.
 Dave Witkin was formerly a partner in StatisTrade, a trading strategy modeling and consulting company. Mr. Witkin has traded stocks, commodities, and options over the last 20 years, and in 2011 was featured in Dr. Van Tharp's book, "Trading Beyond the Matrix."