

Last week, The Washington Post published a comprehensive article that effectively said the greatest risk of recession is coming from corporate balance sheets, not consumers’. They wrote in “Beware the ‘mother of all credit bubbles’”:
“This time, however, it’s not households using cheap debt to take cash out of their overvalued homes. Rather, it is giant corporations using cheap debt—and a one-time tax windfall—to take cash from their balance sheets and send it to shareholders in the form of increased dividends and, in particular, stock buybacks. As before, the cash-outs are helping to drive debt—corporate debt—to record levels. As before, they are adding a short-term sugar high to an already booming economy. And once again, they are diverting capital from productive long-term investment to further inflate a financial bubble—this one in corporate stocks and bonds—that, when it bursts, will send the economy into another recession.”
FIGURE 1: CORPORATE DEBT AT RECORD LEVELS AND MOVING HIGHER
Total credit to nonfinancial corporations, as % of GDP
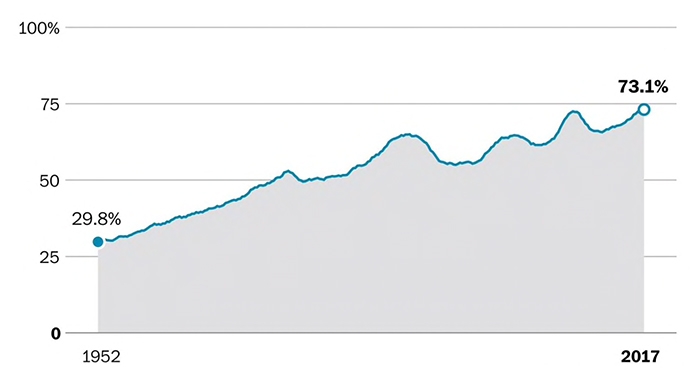
Sources: The Millstein Co., The Washington Post
In addition to the magnitude of the debt numbers and rising trend, the article cites several troubling aspects of the corporate debt boom:
- Net payments to shareholders are coming at the expense of capital expenditures (Figure 2).
- Affluent Americans are deriving the primary short-term benefit from the debt trend, while the broader economy may be hurt down the road by less emphasis on investment in corporate R&D, new plants and facilities, employee training, and new product development.
- The net issuance of public stock—new issues minus buybacks—has been negative $3 trillion over the past decade, helping lead to a lower stock supply. This is possibly a contributing factor to stock valuations that are above historical averages.
- There has been an increasing trend toward lower-rated corporate debt issuance. However, The Economist cites S&P Global Ratings, who say debt is now more evenly distributed than before the credit crisis. According to their analysis, “Only 27% of American firms in 2017 were highly levered (defined as a debt-to-earnings ratio higher than five), down from 42% of firms in 2007.”
FIGURE 2: PAYMENTS TO SHAREHOLDERS VS. CAPITAL EXPENDITURES
% of revenues for nonfinancial corporations in S&P 500
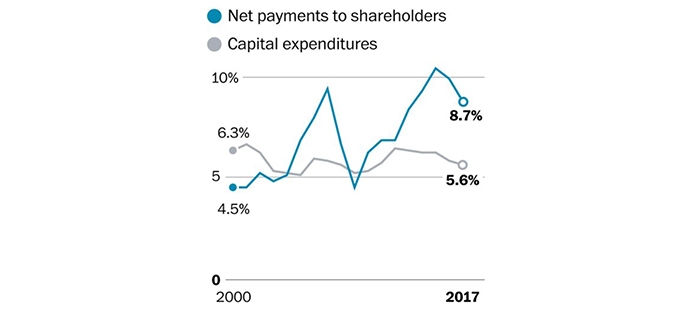
Sources: The Millstein Co., The Washington Post
Another factor to watch is the growth of debt on the consumer side. While the distinct trend after the credit crisis was for consumers to deleverage their household balance sheets, consumer debt is slowly on the rise again. According to Trading Economics, “Households debt to GDP in the United States averaged 57.8 percent of GDP from 1952 until 2017, reaching an all-time high of 98 percent of GDP in the first quarter of 2008.” As of Q4 2017, it now stands at 78.7%, up modestly from the recent lows of 2016 but showing a steady move higher.
FIGURE 3: % U.S. HOUSEHOLD DEBT TO GDP
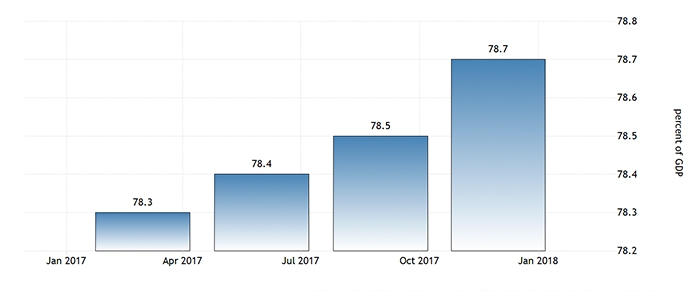
Source: Trading Economics, Bank for International Settlements