


What Coppock wanted was an indicator that would help identify the really juicy bottoming conditions that only appear every few years. The indicator shows those conditions when it goes to a deeply negative value and then turns up, and that upturn is key. When it is below zero and falling, that is typically a pretty bad time for stock prices.
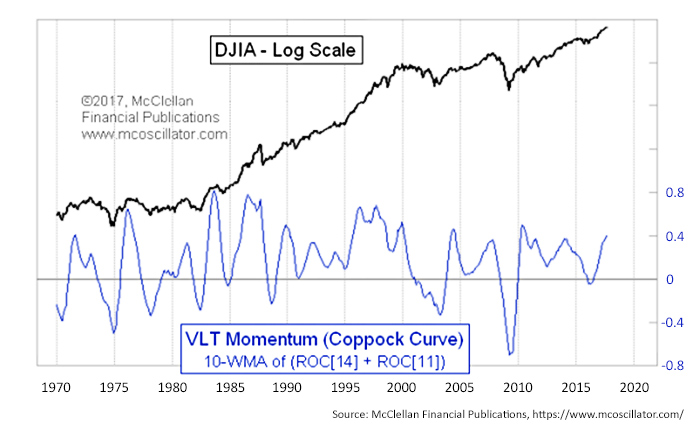
Technicians also use it for other purposes, including as an identifier of general trend direction. In this respect, it can be somewhat problematic, since prices can continue to rise for a while after the Coppock curve turns down. And like any indication of trend direction, it can be subject to whipsaws.
Coppock chose the unique math for his indicator in an interesting way. He was managing money for an Episcopal church. In a conversation with one of the priests, Coppock learned that the typical grief period experienced by a person after the loss of a loved one takes around 11–14 months. Coppock figured that the same sort of feelings of grief were involved in how people felt about losses they suffered with their investments. So, he combined the 11-month and 14-month percentage changes in the DJIA and then ran a 10-month weighted moving average (WMA) of that data to get the indicator you see in Figure 1.
In a 10-month WMA, the most recent month’s data gets a weighting of 10. The month before that gets a weighting of 9, and so on, going back to 10 months, which gets a weighting of just 1. You then divide by the sum of those weighting factors, which is 55. An indicator developer nowadays might employ different math to get at the heart of that 11-to-14-month grieving period, because a WMA is somewhat more difficult to calculate (although my computer does not seem to care). But we should understand that Coppock developed this idea back in the 1960s, when the use of moving averages of any type was still a new idea, especially for the financial markets.
With a little more math, we can calculate the price at which the Coppock curve would turn down. I call that the “Coppock Unchanged” number, because if the DJIA were to close at exactly that value, then the Coppock curve would be exactly unchanged. A close below it means that the Coppock curve turns down. I’ll spare you the full derivation of that formula, as it is a bit intensive. (For those interested in more information, see Calculating the Coppock Curve.)
FIGURE 2: ‘COPPOCK UNCHANGED’ TREND LINE (2000–2017)
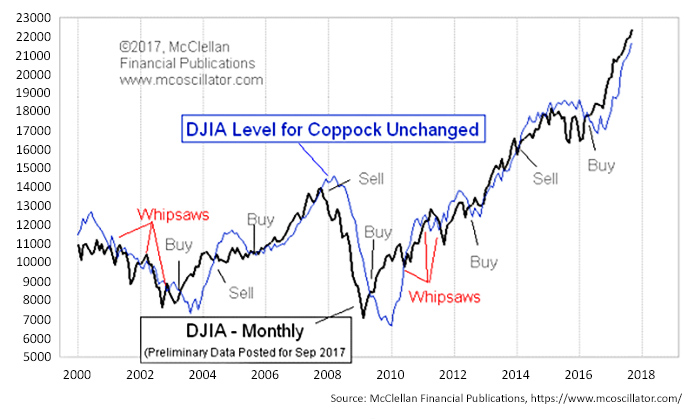
The Coppock Unchanged line is racing up faster than the DJIA, and so at some point, we are going to see prices cross below it. As noted in the chart, this can be a good sell signal sometimes, and it can also be subject to whipsaws. The Coppock Unchanged value for September is 21,678.94, so the DJIA would have to drop pretty hard on September 29, the final trading day of the month, to trigger this signal. But for October, that number goes up to around 22,400 (depending on September’s monthly close), so a signal gets easier to see with each passing month.
I noted previously that these Coppock curve downturn sell signals can sometimes be misleading. What can be said is that when the Coppock curve gets up to a high level, the uptrend gets pretty stretched, and the gains get harder to come by. That is something we already know from the stretched valuations, but it is nice to see it in another way too.
The opinions expressed in this article are those of the author and do not necessarily represent the views of Proactive Advisor Magazine. These opinions are presented for educational purposes only.
This article was first published by McClellan Financial Publications on September 28, 2017.
 Tom McClellan is the editor of The McClellan Market Report newsletter and its companion, Daily Edition. He started that publication in 1995 with his father Sherman McClellan, the co-creator of the McClellan Oscillator, and Tom still has the privilege of working with his father. Tom is a 1982 graduate of West Point, and served 11 years as an Army helicopter pilot before moving to his current career. Tom was named by Timer Digest as the #1 Long-Term Stock Market Timer for both 2011 and 2012. mcoscillator.com