


At that time, the $VIX calculation involved four series of S&P 100 options ($OEX)—the most popular and liquid index option at the time. That was the original $VIX calculation, and it was introduced earlier in 1993. It persisted through 2003. So, in December 1993, the only $VIX calculation was that “original” $VIX. Today, the symbol $VXO denotes that original $VIX calculation, which is still being disseminated today.
In 2003, the $VIX calculation changed. Instead of using four series of $OEX options, the calculation began to use two complete strips of monthly S&P 500 options ($SPX). $SPX options had replaced $OEX as the most active index option. Moreover, the use of the strips allowed the introduction of many strikes into the calculation—supposedly giving a better measure of implied volatility. In reality, the original $VIX and the “new” $VIX of 2003 were quite similar.
At some point in time, the CBOE backdated that “new” calculation back to 1990. Apparently, there were monthly $SPX options back to that time. That monthly calculation was eventually replaced in 2014 by the current $VIX calculation, which uses all expiration dates (weeklies, monthlies, quarterlies, etc.). The 2003 calculation is known as $VIXMO today.
Now, back to the topic at hand. In 1993, when the only $VIX calculation was the original one, these prices occurred:
TABLE 1: “ORIGINAL” VIX PRICES
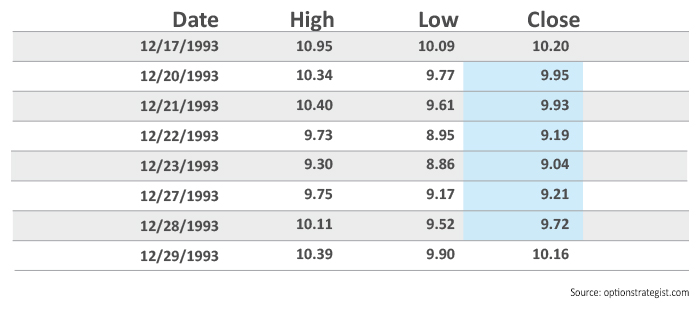
Hence, it is obvious that there were six consecutive days when $VIX closed below 10 (using the data and calculations that existed at the time, not backdating using the newer calculation). I realize this is a minor point, but using backdated data when there was an actual $VIX calculation at the time just doesn’t seem to be the correct way to analyze $VIX historically.
What are the ramifications of multiple $VIX lows?
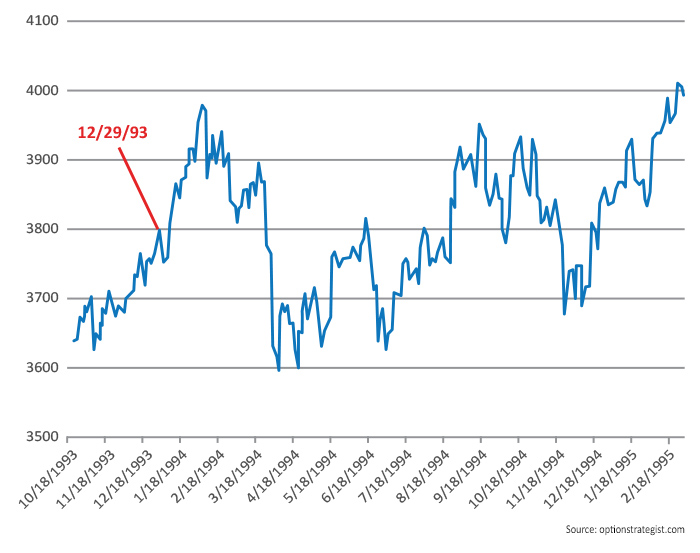
How did the market react after $VIX traded at those low levels in 1993? Figure 1 shows the Dow, not $SPX, but they behaved in a similar manner. The Dow fell a little after the six-day period of extremely low $VIX, but in the larger sense, it rallied until February 1994, before falling sharply in March and bottoming for the year on April 4, 1994.
FIGURE 1: DOW JONES 30 INDUSTRIALS
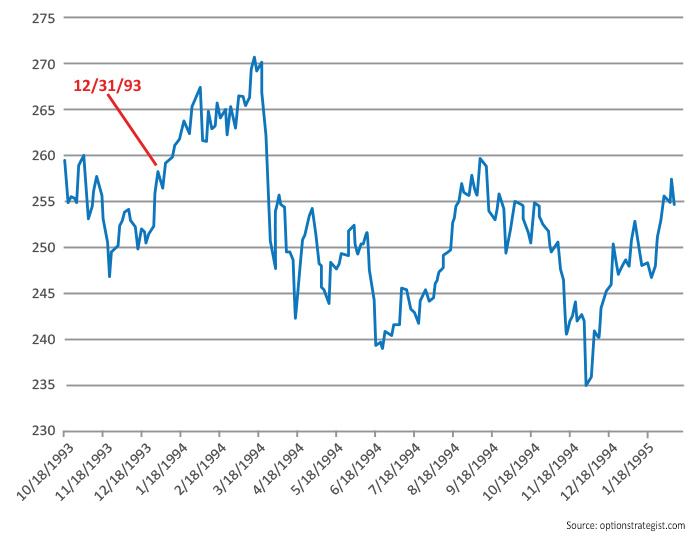
The Russell 2000 ($RUT) had a different pattern (Figure 2). It barely backed off at all after the period of low $VIX ended, and it rallied to new highs through the end of March 1993. The Fed had a surprise rate rise just after that, and that sent $RUT into a tailspin that bottomed temporarily in June 1994. However, it went to lower lows in December 1994.
Many considered small-cap stocks to be in a “stealth” bear market from March to December of 1994. The bottom came shortly after the Orange County, California, trading scandal in December 1994 (where County Treasurer Robert Citron had invested in highly leveraged bond positions; one of the largest counties in the country had to declare bankruptcy).
FIGURE 2: RUSSELL 2000
The 1993 series of $VIX readings below 10 didn’t have much of an immediate negative effect on the market, although a roughly 10% drop did develop a few months later. One can’t expect a repeat of a market condition that occurred 23 years ago, but the point is that these extremely low levels of volatility can’t persist. The only way “out” is for the market to correct.
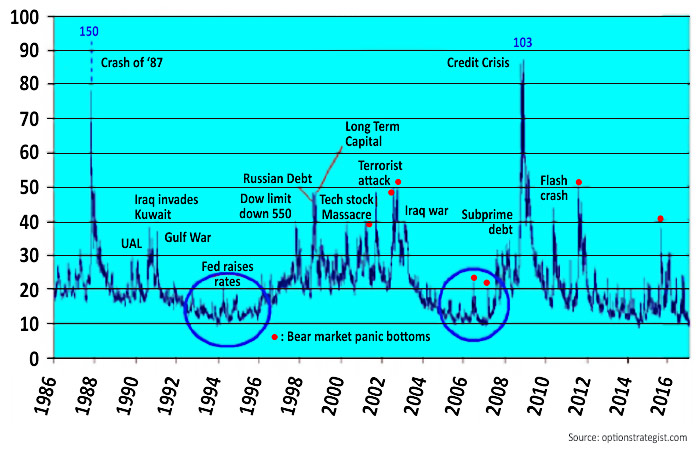
Finally, the long-term chart of $VXO is presented in Figure 3. Note the two low periods of $VXO: 1993–1996 and 2005–2007, circled in blue. $VXO rose sharply after those low periods, but the market behaved differently. There was a bullish market from 1996 to 1998, but $VXO rose anyway because realized volatility was increasing due to the erratic, but bullish, movements of many tech stocks. The opposite occurred in 2007 and 2008, of course, as $VXO rose while the stock market collapsed. One depressing fact on this chart: $VXO stayed relatively low for nearly two years after first trading below 10 (ugh!).
FIGURE 3: $VXO ($OEX IMPLIED VOLATILITY)
The opinions expressed in this article are those of the author and do not necessarily represent the views of Proactive Advisor Magazine. These opinions are presented for educational purposes only. This presents an abbreviated version of an article that first appeared at optionstrategist.com on July 25, 2017.
Editor’s note: Following the original publication date of this article, the VIX ended up putting in 10 consecutive days of closes under 10, according to data from Yahoo Finance.
 Professional trader Lawrence G. McMillan is perhaps best known as the author of “Options as a Strategic Investment,” the best-selling work on stock and index options strategies, which has sold over 350,000 copies. An active trader of his own account, he also manages option-oriented accounts for clients. As president of McMillan Analysis Corporation, he edits and does research for the firm’s newsletter publications. optionstrategist.com