
Biting the bullet: Assessing investment performance
Biting the bullet: Assessing investment performance

The problem with using single point values in assessing investment performance.

Imagine you are interested in an active investment strategy that has a five-year track record. One typical metric for assessing its performance is the compound annual return (CAR), or average yearly return, which in our example is 10% over the five-year period. The problem with using this point value to evaluate the strategy is that any knowledge of the five individual yearly returns disappears. Were most years close to 10%? Or very different? We can’t tell because what we did was compress five individual results—each annual return—into a single number. This is similar to firing a shotgun shell with five pellets, but treating it like bullets from a rifle that had all landed at the same spot. Unfortunately, averaging all five holes into one doesn’t mean you actually hit the bull’s-eye, even if the result were dead-on (Figure 1).
Figure 1: Mathematically combining multiple results into one
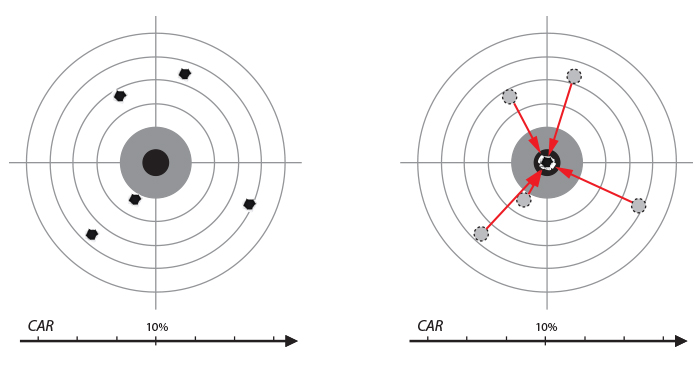
The information we have lost in using CAR to describe profitability is how spread out the five annual returns were. Did one superb year compensate for four losing periods? Or was there a strong consistency over time? Wouldn’t that knowledge influence your investment decision?
But let’s take this one step further. Even though we all know that “past results are no guarantee of future outcomes,” we still use track records to form an expectation of what may lie ahead. Therefore, in our example it wouldn’t be unusual for one of our clients to assume a CAR of 10% next year, right? Let’s say the active strategy only yielded 4% in the following year. Should you and your client remain calm and stick with the strategy, or is it “broken?” After all, the “bullet” (4% return) missed the bull’s-eye (10% return) by a significant amount (Figure 2).
Figure 2: Assessing a new result
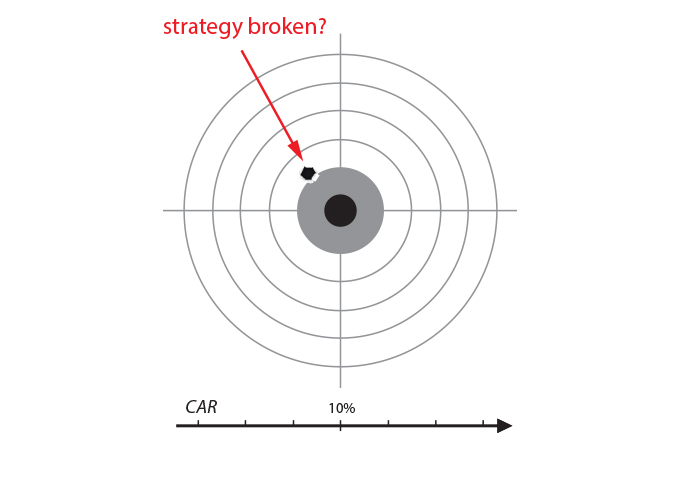
Now here’s where the information about the variation in historical returns comes in handy. In Figure 1 we compared the yearly results to holes punched by shots. Had you known that all five projectiles came from a very accurate marksman and all previously hit the bull’s-eye, how would you feel about the next bullet striking significantly off-center? Contrast that with the idea that this new hole was instead pierced by a shotgun pellet and is still well inside the “cloud pattern” made by the previous shell. Wouldn’t you worry in the first case, but still be relaxed in the latter?
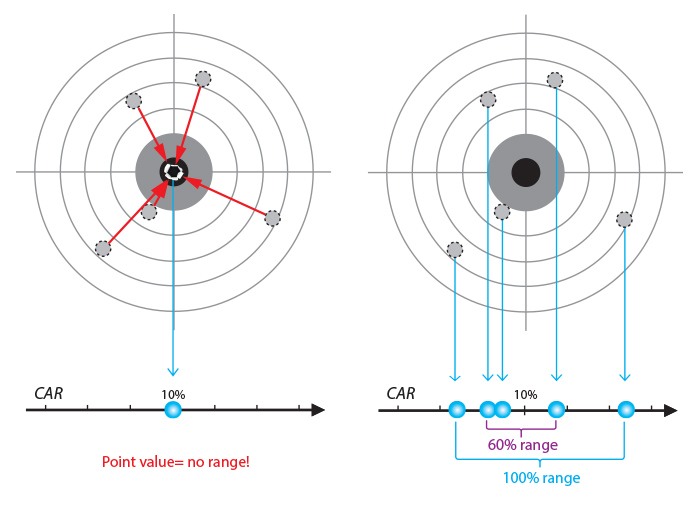
Mathematically speaking, what we are talking about here is the distribution of individual results (i.e., annual returns) and whether a new value should be considered “normal” or not. A very simple way to evaluate normality is to compare the new value to two numbers representing a range (the minimum and maximum) instead of only one (the average). To keep things simple, our example and graphics only encompass five values, but in reality you would want to look at ranges derived from a larger number of data points.
However, we need to add a little finesse to acknowledge statistically significant results. By removing the data points at the outer 10%-20% of both sides of the distribution range, we eliminate outliers that are not representative of the typical “hit area.” In our example, we ignore the leftmost and rightmost target hits and use the remaining three out of five hits (60% range).
Figure 3: Replacing point values with ranges
The concept of ranges may appear a bit fuzzy at first, but that’s actually the very reason for using them—gauging “normalcy” from values that are more or less different from each other. Active strategies are not machines that repeatedly deliver a precise output, but rather show a certain variation in their results. This is unlike most products we are exposed to in our modern world, where standardization prevails and one hamburger looks and tastes like the next. But once you grasp the concept, the benefits become clear.
Let me show you by getting back to our example from Figure 2. Our goal is to judge whether the latest result is normal or an indication something may be wrong. Comparing the new data to the range covered by previous results, we can easily determine that we have little reason to worry. Even if we cut off 20% at both ends of the range, the value is still within the remaining area (Figure 4).
Figure 4: Comparing new values to ranges
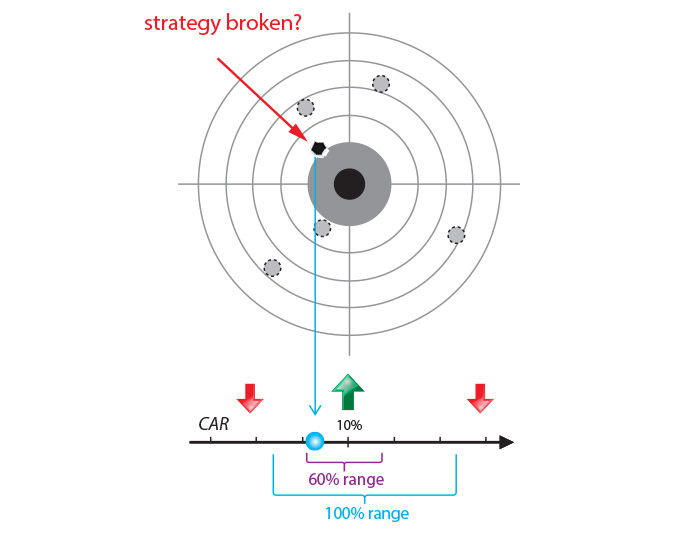
Armed with the information that previous results were spread out and not the result of “marksman-like” precision gives us the perspective we need to assess the meaning of new data in an objective manner. This will eliminate a lot of emotional stress both for you and your clients, since it takes second-guessing based on gut feeling out of the discussion.
Let’s summarize the advantages of considering ranges over single point values:
- Ranges acknowledge that we are dealing with variable outcomes and help us appropriately set expectations instead of giving a false impression of precision.
- The size of the range indicates the volatility of the data points, which is critical for investment decisions, especially when withdrawals are involved (please see previous Proactive Advisor Magazine article from 1/22/15 titled, “Can lower returns lead to more money in retirement?”).
- When comparing new results to a range derived from historical data, we can easily identify abnormal values and objectively decide whether or not to stick with the underlying strategy.
Investment portfolios require continuous assessment to ensure clients are tracking toward long-term goals.
Educating clients and setting expectations is a major part of being an investment advisor. Getting into the habit of using ranges rather than point values when significant variability is involved is a simple, yet effective, way of describing both past and future outcomes without losing critical information. Given that investment markets are dynamic, an investment portfolio requires continuous assessment to ensure that clients are tracking toward their long-term goals—not hitting one specific return target for any given year.
It makes sense to “bite the bullet” by using an expected range of numbers—instead of just one—to add a new dimension to your client’s understanding.
The opinions expressed in this article are those of the author and do not necessarily represent the views of Proactive Advisor Magazine. These opinions are presented for educational purposes only.
This article first published in Proactive Advisor Magazine on March 5, 2015, Volume 9, Issue 5.
 Thomas Krawinkel, MBA&E, was a co-founder and partner at StatisTrade LLC, a trading strategy evaluation firm that worked with fund managers and family offices to evaluate and improve trading system performance using advanced statistical techniques. An engineer by training, Mr. Krawinkel has been active in the markets since the 1980s. He won the National Association of Active Investment Managers (NAAIM) 2011 Wagner Award for insights related to success factors for system performance.