


A common misconception among fundamental investors is that technical analysis is used to predict or time the market. No one can predict the market, and timing the market is, at the least, a very challenging task. This has always been a wedge in the argument between fundamentalists and technical analysts.
Relational technical analysis embodies both concepts, and I believe it is a sophisticated way to guide investors of all levels and skill sets. Looking at a chart will not tell you exactly how a stock will move the next day, week, or month, but it can give you vital information about what has happened in the past and clues to future direction. The stock market tends to have repeating patterns in price and volume that can give an investor information leading to more prudent decisions.
By using stock chart analysis with fundamental analysis, you will see a snapshot of the stock or market at that point in time and how it relates to what is going on over the long term. Understanding the long-term trend, and where the market is in its normal cycles, will improve your decisions for long-term investing.
Monthly and weekly chart views are best for long-term investing. You should rarely, if ever, use daily charts. The “white noise” of daily price fluctuations has no value to long-term decision-making.
The Dow Jones Industrial Average (DJIA) dates to 1896 and is still considered one of the premier indexes for the U.S. equity market, although it only contains 30 companies and 23 of the now 146 specific industry segments of the U.S. economy.
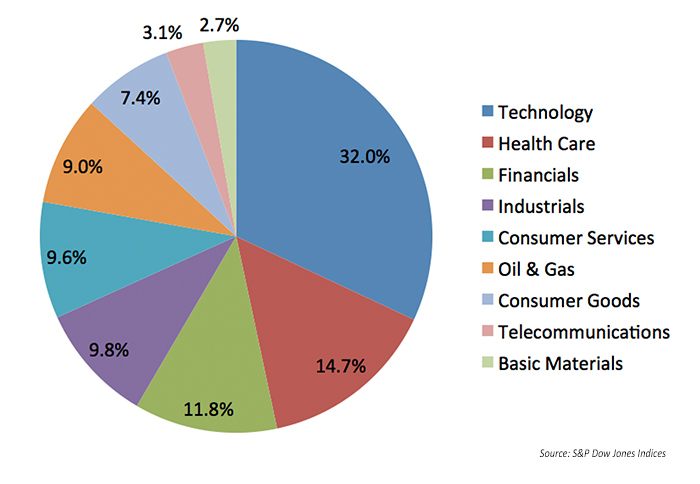
The DJIA has gone through several significant changes over the past five years in terms of its component stocks, most notably dropping Alcoa, AT&T, and Bank of America and adding Apple, Goldman Sachs, and Nike. However, the DJIA, according to information from S&P Dow Jones Indices, is a price-weighted measure of “all industries except transportation and utilities.” Technology has grown to be by far the largest broad industry sector in terms of market capitalization.
FIGURE 1: DJIA BY INDUSTRY WEIGHTING
A monthly chart of the DJIA over several years provides a long-term view of price trend. Figure 2 tells us several things about the condition of the stock market as represented by some of the most important and influential companies of the U.S. economy:
- The angle of ascent has been climbing steeply since late 2016.
- The volume, or amount of stocks exchanging hands, has been rising in tandem with the value of the DJIA, which is a good sign.
- The detrending price oscillator (DPO) in the bottom chart window is a cycle indicator that has been around for many decades. It now shows the current cycle is at risk of a peak, with the DPO at the upper limit of its typical pattern.
FIGURE 2: PRICE TREND FOR DJIA (2014–2017)
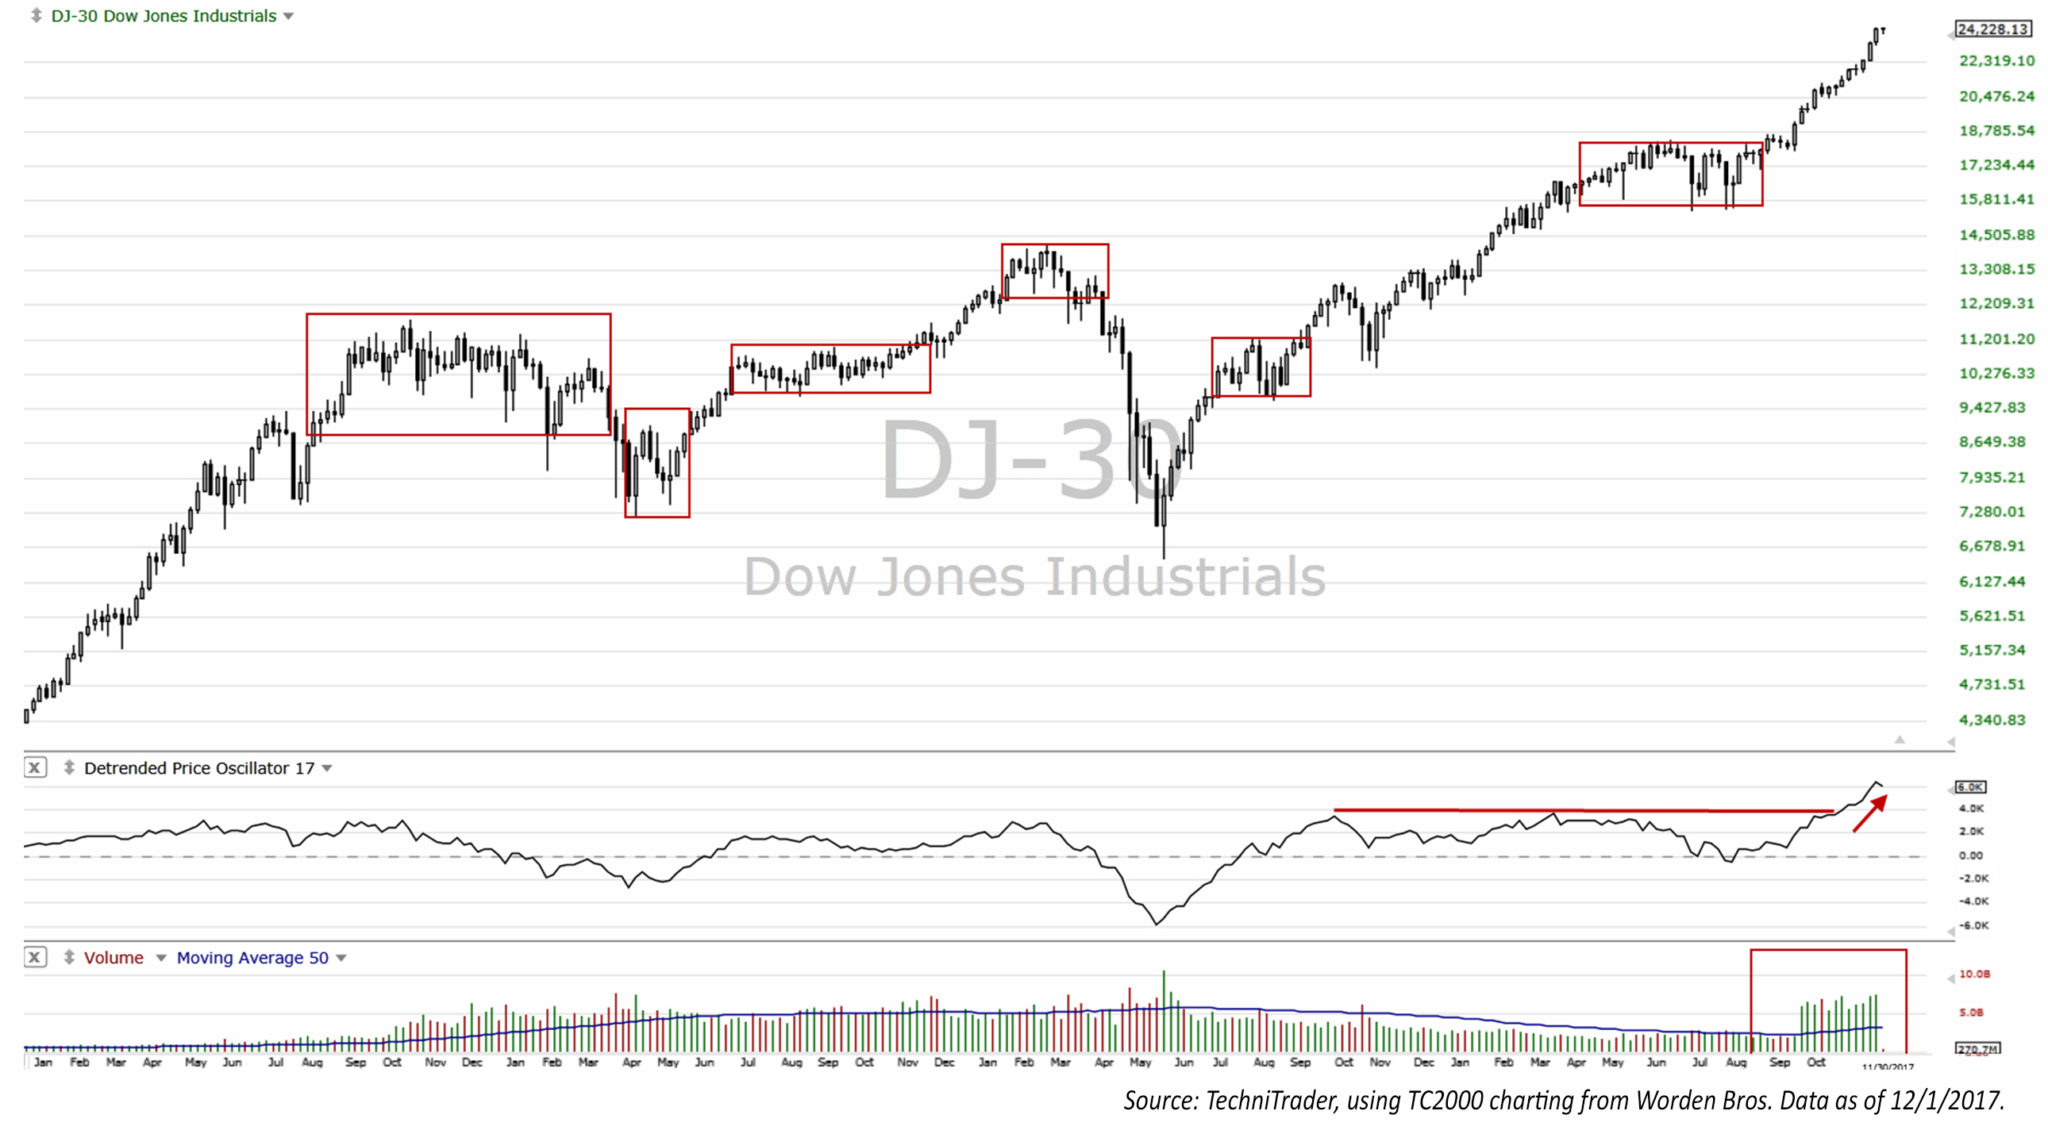
It is also apparent, as indicated by the rectangles drawn around the patterns on the chart in Figure 2, that the DJIA tends to move sideways more often than not. Technical analysis can be used to help define support and resistance and identify new points of “breakouts” and “breakdowns.”
By understanding the patterns of the Dow, you can add this information to your stock selection process over the long term. If you are considering a Dow 30 component for an investment, be aware that Dow stocks might be a higher-risk entry—given the overall elevated nature of the Index (and the market as a whole). That is not to say those stocks cannot keep moving up in the 2018–2020 period, but that risk management is paramount. I believe TechniTrader’s proprietary analytic methodology of relational technical analysis can help identify opportunities and risk in all types of market conditions, focusing on quantitative, technical, and fundamental factors, as well as risk analysis.
All statements are the opinions of TechniTrader, its instructors, and/or employees, and are not to be construed as anything more than opinions. Examples presented are for educational purposes only. “TechniTrader,” “Relational Technical Analysis,” and “Angle of Ascent” are registered trademarks.
 Martha Stokes, CMT, is the co-founder and CEO of TechniTrader and a former buy-side technical analyst. Since 1998, she has developed over 40 TechniTrader stock and option courses. She specializes in relational analysis for stocks and options, as well as market condition analysis. An industry speaker and writer, Ms. Stokes is a member of the CMT Association and earned the Chartered Market Technician designation with her thesis, "Cycle Evolution Theory." technitrader.com