
Should clients really want to beat the market?
Should clients really want to beat the market?

What does it take to “beat the market”? Is it more important to deliver value to clients in terms of risk-adjusted returns?
Proponents of active management have been somewhat on the defensive over the past several years. With relatively strong stock market performance since the credit crisis, it’s easy to understand the naysayers’ arguments as many actively managed strategies have underperformed the major benchmarks. I am sure many advisors have been asked why clients should employ managers that use active strategies when just being long the broad market indexes has been a pretty successful strategy.
Sophisticated readers understand that well-managed active strategies typically go through temporary periods of underperformance—the reason being their focus on risk management. To really judge the merits of an active approach, one should evaluate the risk-adjusted return over at least one full market cycle and use a proper benchmark. Looking through the rearview mirror of a strong period for stock market performance can lead to some unfortunate client expectations. Nonetheless, it is part of human nature to ask for market-beating performance. In this article, we’ll examine what it might take to “beat the market” and why it’s really not what clients should be after.
As surprising as it seems, it really doesn’t take much. A recent study in the Journal of Portfolio Management addresses this issue. Researchers examined more than 35 different stock portfolio formation strategies and found that, without exception, all outperformed a cap-weighted index of 1,000 large stocks! That’s right, 100% outperformed the index.
This result was especially surprising because the study purposely included strategies the researchers thought would underperform. So the researchers tried another test: simulating the proverbial blindfolded monkey throwing darts to pick stocks. Specifically, they created portfolios by randomly picking 30 stocks and rebalancing once per year. Unfortunately for the index, and much to the surprise of the researchers, the median blindfolded monkey also outperformed.
Lest you think the results are due to a cherry-picked time frame or that levels of outperformance are in the noise, this study covered the period from 1964-2012, and the outperformance ranged from 1.6% (compounded annual return) per year for the “simulated monkey” strategies to almost 5% for some of the intentional strategies.
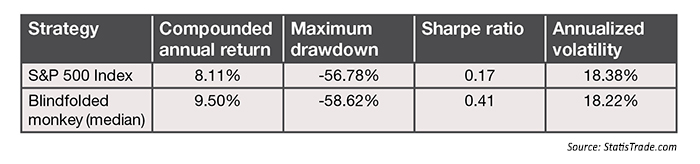
Since the results of this research study were so surprising, I decided to replicate the results using different data. Specifically, I repeated the blindfolded-monkey experiment explained in the research study using the S&P 500 Index from 1986 to the end of July 2015. Taking care to perform a proper experiment (accounting for transaction costs, survivorship bias, etc.), I also found that a median random portfolio of 30 stocks rebalanced annually outperforms the index. The comparison is shown in the following table.
The answer lies in understanding how large-cap stock indexes work. Most stock indexes that people pay attention to are market-cap weighted, meaning that the higher the market value of a company (stock price multiplied by shares outstanding), the larger the weight in the index. For the S&P 500, in practice this means that Apple (AAPL) has a weight of 3.9% while Diamond Offshore Drilling (DO) has a weight of 0.0086%. The effect is that by passively holding the S&P 500 one is essentially owning a disproportionate weighting of the largest of the large-cap stocks, because the rest do not impact the index in a meaningful way.
All funds that track a market-cap-weighted index are forced to concentrate capital into the largest of the large-cap stocks. As the stock price for a company like Apple rises, its market cap also rises, and its weighting in the index rises with it. Index funds have to keep buying more Apple stock every time its market-cap weighting increases within the index, creating a positive feedback loop.
As a result, index funds end up owning more of the most expensive stocks because they are mandated to buy more as a stock’s price rises. An index fund will always have the largest position in a stock at its peak. Conversely, it will also have the smallest position when a stock troughs. This is the ultimate expression of buying high and selling low—exactly what investors are taught not to do.
In this particular case, researchers found that a large portion of the outperformance could be explained by valuation (low valuation assets tend to outperform high valuation assets). In other words, all of the non-cap-weighted portfolios did better at not violating the golden rule of buying low and selling high. It’s not that blindfolded monkeys are great value investors, it’s simply that they don’t purposely pile into expensive stocks as index funds must.
So with such outperformance, why not just outsource portfolio management to a monkey? Well, even with the outperformance, many investors would still not like the result. Figure 1 shows the median of the blindfolded-monkey strategy performance (red) vs. the S&P 500 (blue).
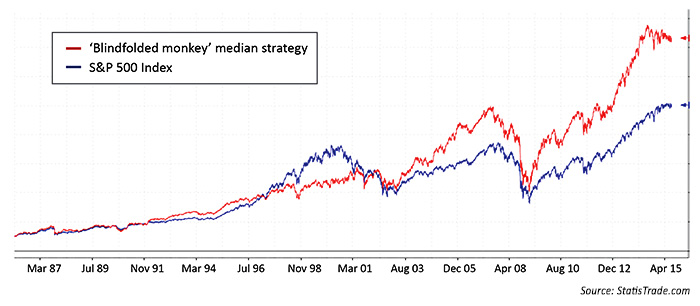
Although the blindfolded-monkey strategy is better than passively holding the S&P 500, the net return tells you nothing about the risk (drawdowns and volatility) taken along the way. Some people may look at the equity curve and think they like the end result of the monkey strategy (red), because the final value is much higher. However, one just needs to read a recent DALBAR study to understand that the average investor would not be able to stomach the 58% account drawdown along the way and might likely bail out at a low point, missing the ensuing gains. Instead, the most important metric that clients should focus on is risk-adjusted return.
Active management is all about providing client value in terms of risk-adjusted return; this is much more difficult than outperforming the S&P 500 simply based on net return. Though many excellent actively managed strategies may underperform the market during strong periods, over a complete market cycle they shine by avoiding large risks. Beating the market on a risk-adjusted basis over a complete market cycle takes much more than a monkey randomly throwing darts.
If a client complains that their actively managed portfolio has been underperforming an index, you can first reassure them of the merits of risk management over the long run—and why risk-adjusted return is a better assessment tool. But you can also point them to this study. After all, any blindfolded monkey can “beat the market,” but that’s not what investors should really be after.
 Dave Walton, MBA, was a co-founder and partner at StatisTrade LLC, a trading strategy evaluation firm that worked with fund managers and family offices to evaluate and improve trading system performance using advanced statistical techniques. Mr. Walton won the National Association of Active Investment Managers (NAAIM) 2014 Wagner Award for one of his innovative system validation methods.