
The backward nature of sentiment indicators
The backward nature of sentiment indicators

Investor sentiment is a useful gauge of potential market direction, but not the way many investors believe.
As a child, I vividly remember the cliff divers in Acapulco who had to time their dives from high on a cliff into a narrow inlet with each wave. If they jumped when the water covered the rocks, the wave would recede before they landed, and they would be smashed on the rocks below. They had to jump while the rocks were showing, having faith that a few seconds later a wave would be there to cover the rocks. Talk about courage!
Similarly, the financial markets are merely an ebb and flow of the balance between buyers and sellers. The flow is often counterintuitive, like jumping when you see rocks, but really it is more like not watching the hand the magician wants you to see—and watching what else is happening instead.
It may seem odd to look at financial markets as sentimental, but investor sentiment indicators are a useful gauge of the possible future direction of a market. True, no one knows exactly what the market will do on any particular day. Short-term events are often driven by the daily news and frequently make no sense at all.
Supply and demand drive markets—and sentiment indicators provide clues
Over the long term, however, supply and demand—the balance in the numbers of buyers and sellers at any one point in time—drive markets. When this relationship is in balance, prices will be stable. When buyers outnumber sellers, prices rise. When sellers outnumber buyers, prices decline.
Price declines can be caused either when buyers become uncertain and hold back or when sellers show up in larger numbers than normal. When both happen at the same time, prices can drop quickly. This is simply “Economics 101.”
Sentiment indicators report the sentiment of different groups of market players such as investors, money managers, or newsletter writers. When sentiment comes into play, it can often seem backward, like so many things in this business do. What’s more important than the actual sentiment numbers reported is the potential for change represented by the numbers.
Bullish people invest their money because they believe the market is strong. Reports that the numbers of bullish investors or managers have risen sound encouraging on the surface.
But let’s analyze what is really happening.
The number of investors who “like the market” is high. Normally those same investors, if they like the market, will have put their money where their mouth is and are invested. So far this makes sense.
But, bullish sentiment numbers are often telling us that it is time to sell, not buy as you might think, because the number of people who have already invested their money has risen.
When you think about this, you will realize that those who have invested their money are no longer potential buyers but have now become potential sellers. When the number of potential sellers is greater than the number of potential buyers, a condition is created from which markets move lower. At a point, all that is needed for the market to decline is some of that daily news that can drive prices down for no apparent reason.
It also works the other way, when everyone is bearish on the market. This indicates a shortage of potential sellers because everyone has already sold, and there is lots of cash on the sidelines. This often acts like rocket fuel for stock prices when a market turns around and buyers invest their cash.
Sentiment indicators are sometimes categorized as “contrary indicators,” implying that the people polled are always wrong, which is far from the truth. Those who use that label just can’t see beyond the surface of the numbers and understand what they mean—or they don’t want you to understand it. This is another face of the Wall Street propaganda machine trying to get you to take the unprofitable side of an investment, so they can make money off you. Don’t fall for it.
What happened yesterday in the stock market won’t make you any money. What will happen tomorrow is what counts. So, to keep our eye on the ball, we must not focus on the numbers of buyers and sellers yesterday. We will do much better if we look at what the numbers of potential buyers and sellers are telling us is more likely to happen tomorrow.
Sentiment indicators are only one investment tool. Just like a mechanic will have more than one tool in their bag, so do wise money managers and investors.
Three important sentiment indicators
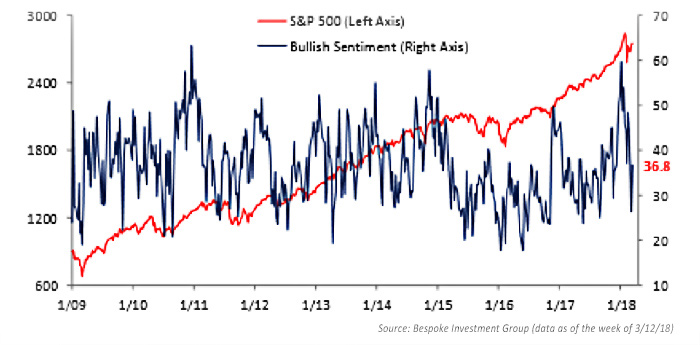
1. The American Association of Individual Investors (AAII) Sentiment Survey (aaii.com/sentimentsurvey) measures and tracks the “market mood” of individual investors on a trend basis. The weekly survey results are published in financial publications, including Barron’s and Bloomberg, and “are widely followed by market strategists, investment newsletter writers, and other financial professionals,” according to AAII.
FIGURE 1: SAMPLE FINDINGS FROM AAII SENTIMENT SURVEY
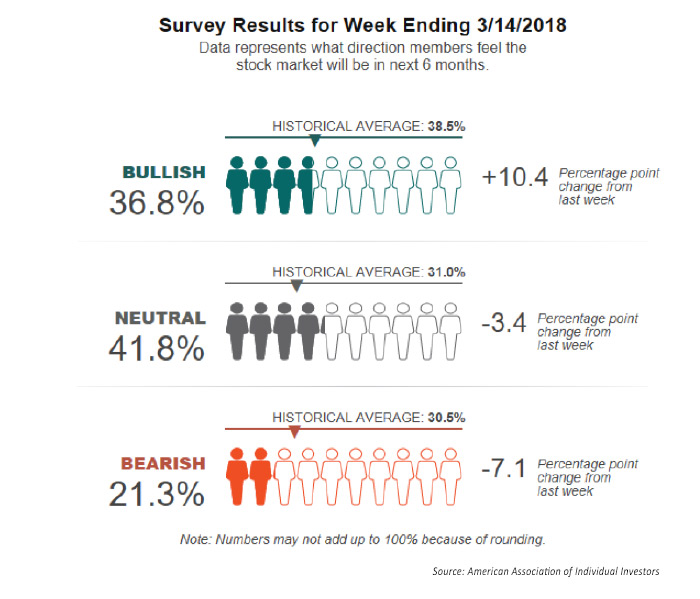
FIGURE 2: AAII BULLISH SENTIMENT (2009–2018)
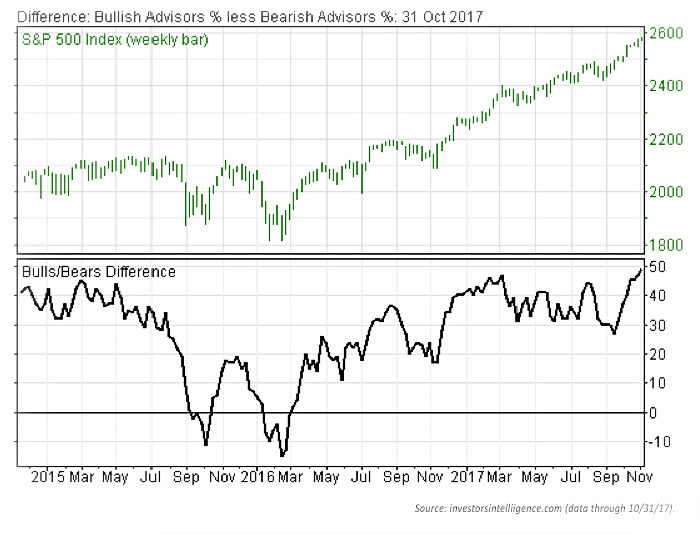
2. The Advisors Sentiment Report from Investors Intelligence employs a method that studies over a hundred independent market newsletters and assesses each author’s current stance on the market—bullish, bearish, or correction—and then combines and tracks the data. The Investors Intelligence website also provides other market-trend analytical reporting for subscribers.
FIGURE 3: SAMPLE OF ADVISORS SENTIMENT REPORT
BULLISH ADVISORS % LESS BEARISH ADVISORS %
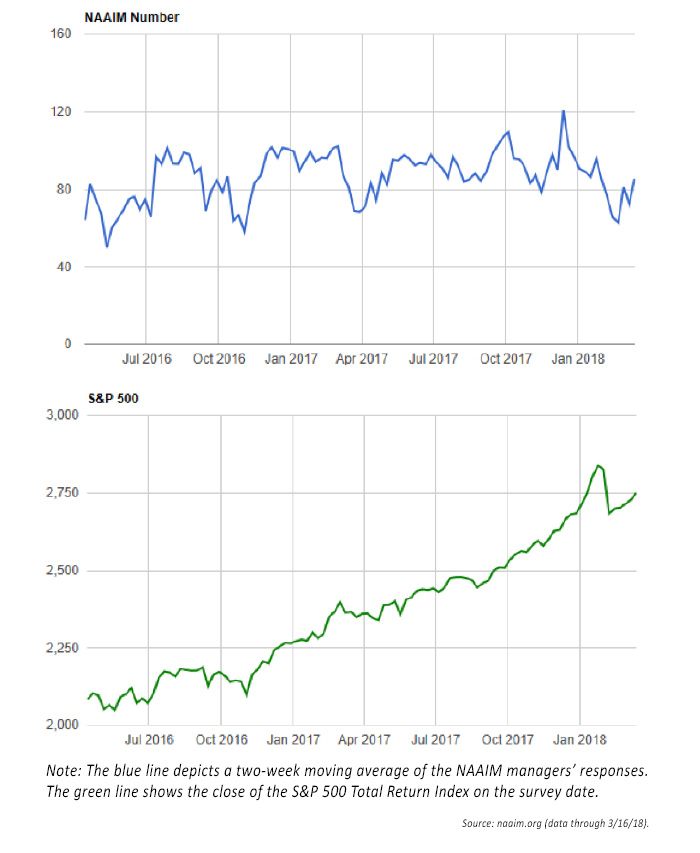
3. The NAAIM Exposure Index tracks active investment manager sentiment and can be found at the National Association of Active Investment Managers (NAAIM) website (naaim.org/programs/naaim-exposure-index/).
The NAAIM Exposure Index represents the average exposure to U.S. equity markets reported by NAAIM members. The association says, “It is important to recognize that the NAAIM Exposure Index is not predictive in nature and is of little value in attempting to determine what the stock market will do in the future. The primary goal of most active managers is to manage the risk/reward relationship of the stock market and to stay in tune with what the market is doing at any given time. As the name indicates, the NAAIM Exposure Index provides insight into the actual adjustments active risk managers have made to client accounts over the past two weeks.”
FIGURE 4: SAMPLE OF NAAIM EXPOSURE INDEX VS. S&P 500 TOTAL RETURN INDEX
 The opinions expressed in this article are those of the author and do not necessarily represent the views of Proactive Advisor Magazine. These opinions are presented for educational purposes only.
This article is an edited extract from “Why Bad Things Happen to Good Investments” by Will Hepburn with additional content regarding specific sentiment surveys. Mr. Hepburn’s book may be purchased at Amazon.
 Will Hepburn is founder and president of Hepburn Capital Management, LLC, which focuses on developing, implementing, and teaching innovative investment strategies. Mr. Hepburn is a past president of the National Association of Active Investment Managers and managed two mutual funds prior to entering private practice. He has taught classes on finance and investing at the college level since 1990 and is the author of “Why Bad Things Happen to Good Investments.” https://hepburncapital.com/