


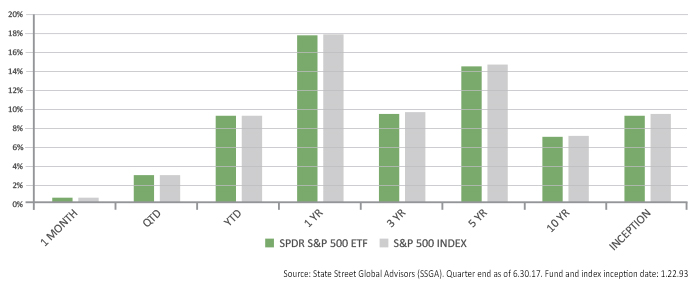
The SPY chart is, therefore, a very useful tool for analyzing the trend of index funds based on the S&P 500, and, of course, the cycles of the SPY ETF itself. An ETF is an exchange-traded fund, so, basically, the SPY ETF is a derivative trading instrument based on the S&P 500 Index. The S&P 500 Index itself cannot be traded. However, the ETF and any other derivative instrument can be bought and sold, allowing investors and traders to participate in the trends of the S&P 500 Index. As can be seen in Figure 1, the performance of SPY closely matches that of the S&P 500 Index, and both have delivered strong performance, particularly over the last five years. Since its inception in 1993, SPY has an average annual return of 9.29%.
FIGURE 1: PERFORMANCE OF SPDR (SPY) AND S&P 500 SINCE 1993
As the use of ETFs has grown over the past few years, so has the popularity of SPY. By studying the SPY daily, weekly, and monthly charts, investors can better understand where the S&P 500 is in its normal cycle. They can then make better decisions for their long-term portfolios. From the chart example in Figure 2, it is easy to see that the last time the trend angled steeply, a correction followed.
FIGURE 2: SPY PRICE TREND (2013–2017)
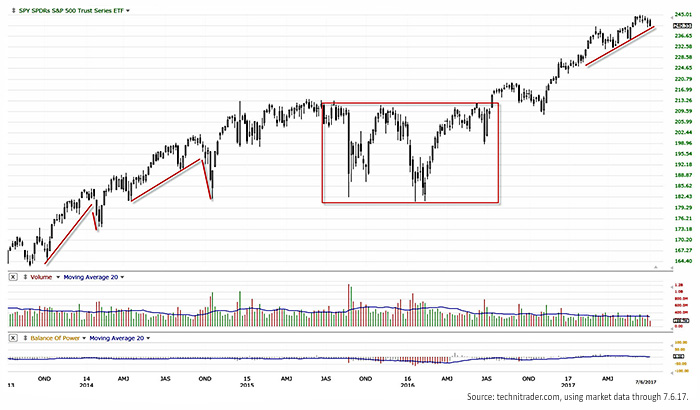
The SPY chart example is set for a weekly scale analysis and shows a rising “angle of ascent” indicative of speculative buying. Volume is lower at this time, indicating that smaller funds, retail investors, and retail traders are buying the SPY more than the giant buy-side institutions using dark pools with alternative trading systems off the exchanges. What is also evident in the volume bars indicator is a relative lack of activity by high-frequency trading firms, which are market-makers for the exchanges.
The SPY, as a derivative of the S&P 500 Index, will always follow the S&P 500 values closely. For this derivative product, the numbers on the side do not represent the “price” of the ETF but rather the “value” in relation to its index. All ETFs are created by the ETF developer (typically a large financial institution) buying shares of stock from the index component list. These shares are then placed into a “trust” and held for as long as the ETF exists. These are not called “shares” because the ETF is not a stock. If demand for the SPY increases, the developer may buy more shares of the S&P 500 component stocks to place into the trust, to create more units to sell via the stock exchanges. According to the SPDR prospectus, “Only certain institutional investors (typically market makers or other broker-dealers) are permitted to purchase or redeem Units directly with the Trust, and they may do so only in large blocks of 50,000 Units known as ‘Creation Units.’”
If an investor is holding the SPY for a long-term investment or retirement investment, it is important to monitor the SPY chart for both weakening value numbers and weakening demand that is shown via the volume bars. As any trend weakens, volume will be the first pattern that begins to decline. The value (i.e., price or numbers to the right side of the chart), will begin to weaken and eventually either retrace on a short-term trend or correct on an intermediate-term trend.
The opinions expressed in this article are those of the author and do not necessarily represent the views of Proactive Advisor Magazine. These opinions are presented for educational purposes only.
 Martha Stokes, CMT, is the co-founder and CEO of TechniTrader and a former buy-side technical analyst. Since 1998, she has developed over 40 TechniTrader stock and option courses. She specializes in relational analysis for stocks and options, as well as market condition analysis. An industry speaker and writer, Ms. Stokes is a member of the CMT Association and earned the Chartered Market Technician designation with her thesis, "Cycle Evolution Theory." technitrader.com