
At Smooth Sailing Indexes, we work on alpha-generating ideas and create products that could have broad application and appeal. This takes observation, analysis, time, energy, and patience.
Occasionally, a repeating pattern gets noticed on the radar screen that can create value for investors with relatively little effort.
Personally, I like “low volatility” strategies, but usually it takes some “oomph” to deliver much higher returns than a target benchmark—before employing risk-taming measures to increase alpha.
Since the beginning of 2016, a binary trading relationship emerged between SPHB (Invesco S&P 500 High Beta ETF) and SPLV (Invesco S&P 500 Low Volatility ETF) that has delivered about 63% excess return above buying and holding the S&P 500, while having 32% greater standard deviation (measured weekly).
But those are raw returns. Simple risk-management techniques can be easily applied to substantially reduce volatility, while harnessing (or even enhancing) the return.
The two ETFs are quite different: SPHB seeks 100 companies within the S&P 500 that are behaving like hungry hyenas, while SPLV seeks 100 companies within the S&P 500 that have the temperament of a sloth. Combining the two into this “idea nugget” is quite simple to actively manage. If the trailing week return of SPHB is greater than SPLV, buy SPHB at the close of this week. If not, buy SPLV. Review the trailing week returns at the end of each week and make a change, if needed. That’s it.
I decided to research this phenomenon going back to the inception of SPHB and SPLV on May 6, 2011. There was no statistical advantage over simply buying and holding the S&P until about five years ago.
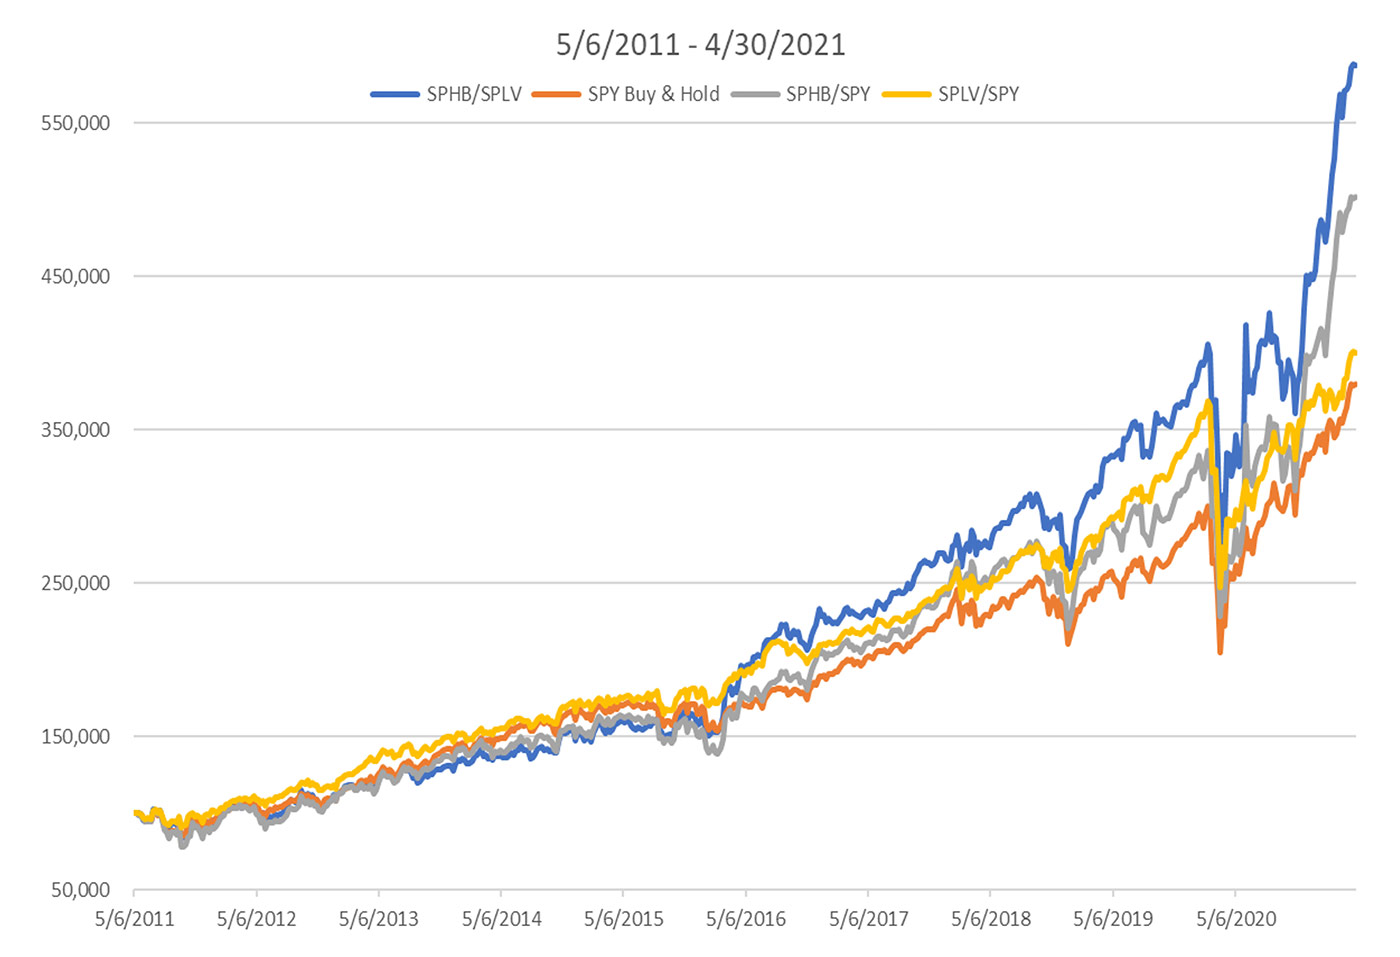
In fact, buying and holding SPLV and SPHB since their inception would have resulted in a lower return than buying and holding the S&P 500 (SPY) over the same period. $10,000 of SPLV grew to $30,200, SPHB grew to $34,100, and SPY grew to $37,700. But, $10,000 into the thematic rotation grew to $58,800—a big difference—and with a nearly equal amount of drawdown (measured at the end of each week). We do not know how long this will last, but it is another intriguing tool for the toolbox.
The most interesting pattern emerges when SPLV is the predominant allocation during trying times in the marketplace—like in February–March 2020, the second half of 2018, the latter part of 2015, early 2016, and so on. And SPHB loves fun times like 2013, the second half of 2020, and 2021.
That is cool! It is intuitive and makes common sense. Be invested in a low-volatility strategy during volatile times in the market (especially to the downside), and be invested in a high-beta strategy when the market is in a strong bullish trend.
I decided to apply the same strategy using SPHB and SPY (for thrill junkies). Zing! $10,000 grew to $50,200—more volatile than SPY but still a noticeable return difference.
Then, while yawning, I applied the same strategy using SPLV and SPY. Zowie! $10,000 grew to $40,100 with 10% less volatility than the S&P 500.
So, for active managers in this new age of low or no trading costs, this can be a choice in your toolbox. A bonus: The same strategy works at the end of each day for hyperactive managers. The SPHB/SPLV binary $10,000 grew to $44,900 with equal max drawdown. And it works if implemented at the end of each month for more strategic managers. $10,000 grew to $47,900—but with an outlier drawdown event in March 2020 due to exposure to SPHB during that month.
These types of results enhance the excess return part of the money-managing balance. An advisor or active manager can then employ the risk-management aspects of the strategy to smooth the journey and, in the end, create excess alpha.

Sources: Smooth Sailing Indexes, market data
 Ian Naismith is a partner and the index designer of Smooth Sailing Indexes Inc., which is a leader in tactical “risk-on/risk-off” index development. Mr. Naismith has been analyzing and trading the markets since the early 1990s. He is a member of the National Association of Active Investment Managers (NAAIM) and has also served as board member and president. www.smoothsailingindexes.com
