

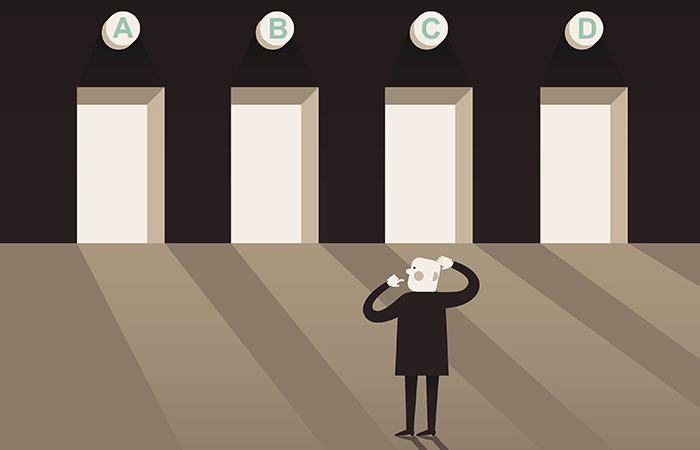
Let’s say you had the choice of the four following investing systems, which would you prefer?
WHICH INVESTMENT SYSTEM WOULD YOU PREFER?
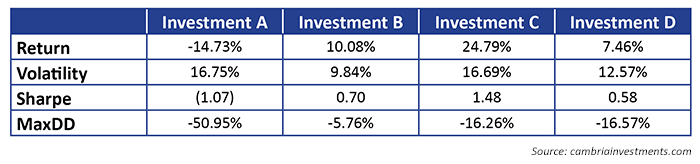
Well, of course, you would say C, B, D, A (in that order). Who wouldn’t? And if you’ve read some of my other articles, you may know that this is likely a trick question.
Investments A and C are actually based on the same system: a passive buy-and-hold approach to the S&P 500. Investments B and D are likewise based on an identical system. In this case, B and D are a simple “timing” or trend approach to the S&P 500 (going long when the index is above its 10-month simple moving average, or SMA, and being out of the market and in bonds when it is not).
COMPARISON OF ‘PASSIVE’ AND ‘ACTIVE’ INVESTMENT SYSTEMS
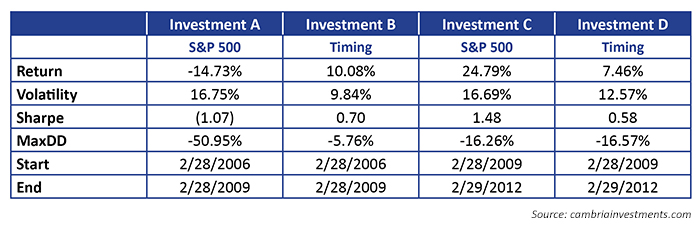
These four seemingly different investment return scenarios—two passive and two active—are simply measured over different time frames. The A and B scenarios show returns during the period February 2006 to February 2009, and the C and D scenarios are from February 2009 to February 2012. I write this to illustrate a few things:
- A basic buy-and-hold beta allocation (S&P 500) can have massively different characteristics depending on the time frame measured. Sharpe ratios of -1.07 to 1.48! Think about that the next time you are marketed to from someone showing an amazing track record with a 1.5 Sharpe.
- An active investing approach often goes years both outperforming and underperforming the benchmark. “Monster” outperformance in the first period can be followed by similar significant underperformance in the latter period.
- Investment professionals often scoff at the inability of individual investors to stay the course with underperforming assets or strategies, but, in reality, the pros can be just as bad as retail investors.
Look at this recent survey from the Financial Times (FT Remark) and State Street Global Advisors (SSGA). (Let’s ignore the truly delusional return expectations of 400 institutional investors with $1.2 trillion in AUM: 10.9%. No chance, no way.)
But let’s examine this one statistic in particular:
HOW LONG IS UNDERPERFORMANCE TOLERATED BEFORE SEEKING A REPLACEMENT?
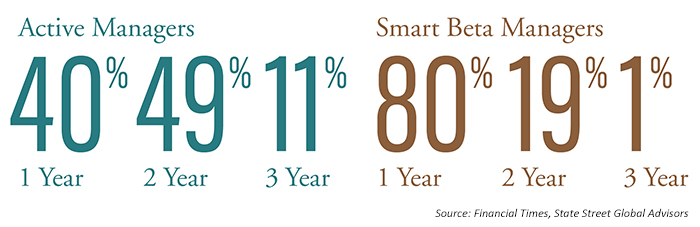
My conclusion, based on the numbers?
100% of these managers would have fired the S&P 500 (passive) in the first period of my example (2/2006–2/2009), and 100% would have fired market timing (active) in the second period (2/2009–2/2012).
More curious fodder for the active versus passive investing debate!
 Meb Faber is a co-founder and the chief investment officer of Cambria Investment Management. Mr. Faber is the manager of Cambria’s ETFs, separate accounts and private investment funds. Mr. Faber has authored numerous white papers and three books: "Shareholder Yield," "The Ivy Portfolio," and "Global Value." He is a frequent speaker and writer on investment strategies and has been featured in Barron’s, The New York Times, and The New Yorker. Mr. Faber graduated from the University of Virginia with a double major in engineering science and biology. cambriafunds.com, mebfaber.com