

The American Association of Individual Investors (AAII) releases its weekly survey of its members every Thursday, and last week’s showed a pretty big spread between the bulls (21%) and the bears (39%). Another 39% of participants are “neutral,” and not willing to make a commitment about their opinion. That’s actually a pretty high reading for the “neutrals.”
When investors shift over to saying that they are bearish in a pretty big way, it is usually a good marker for an intermediate-term bottom for stock prices. Big spikes to the bullish side do not always work out the same way, as they can sometimes be seen at the initiation of a strong new uptrend, such as the one starting after the November 2016 elections.
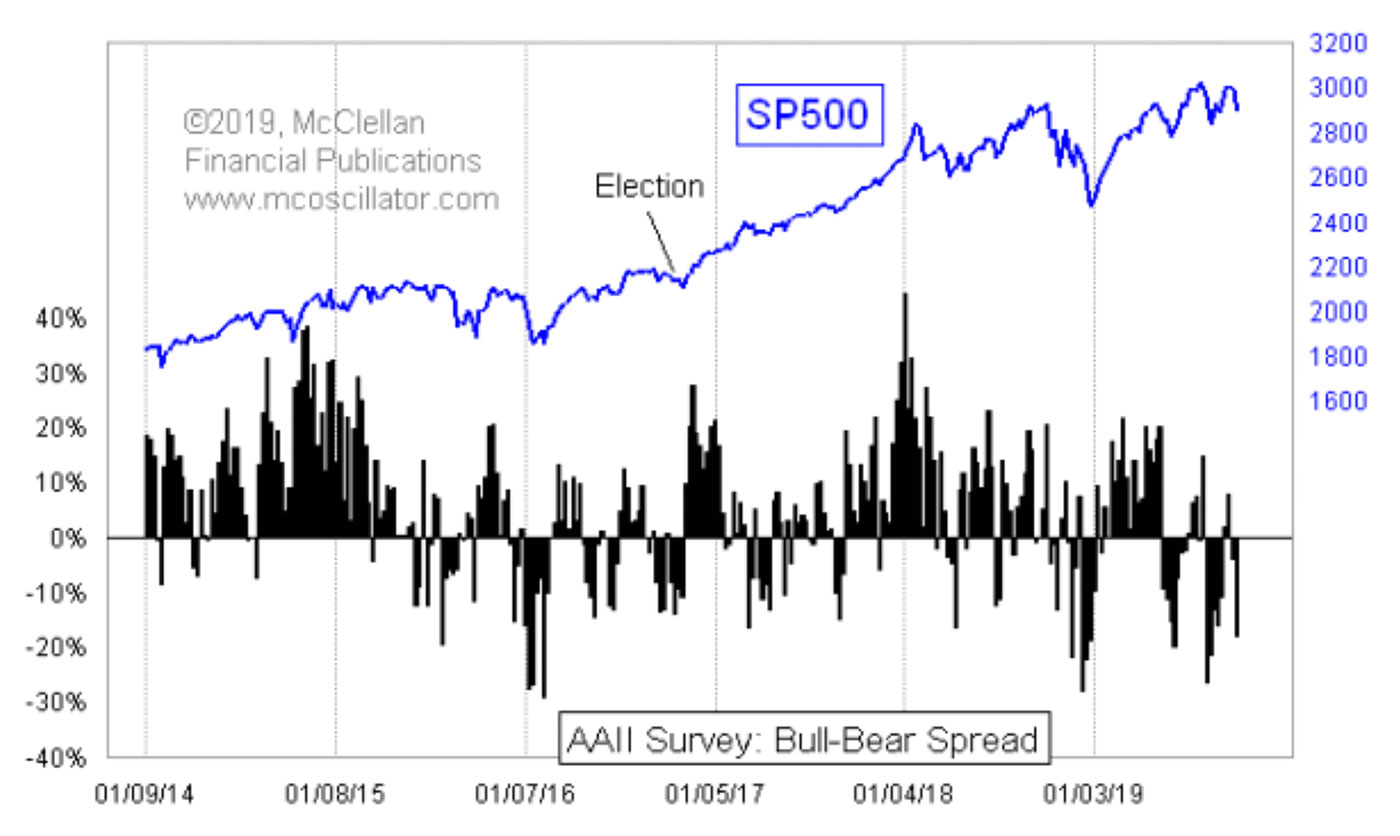
Source: McClellan Financial Publications, AAII
The bull-bear spread is the most common way that technical analysts look at the AAII data, but it is not the only way to do so. One can look at the percentages for each category by themselves. Figure 2 shows just the percentage of bulls.
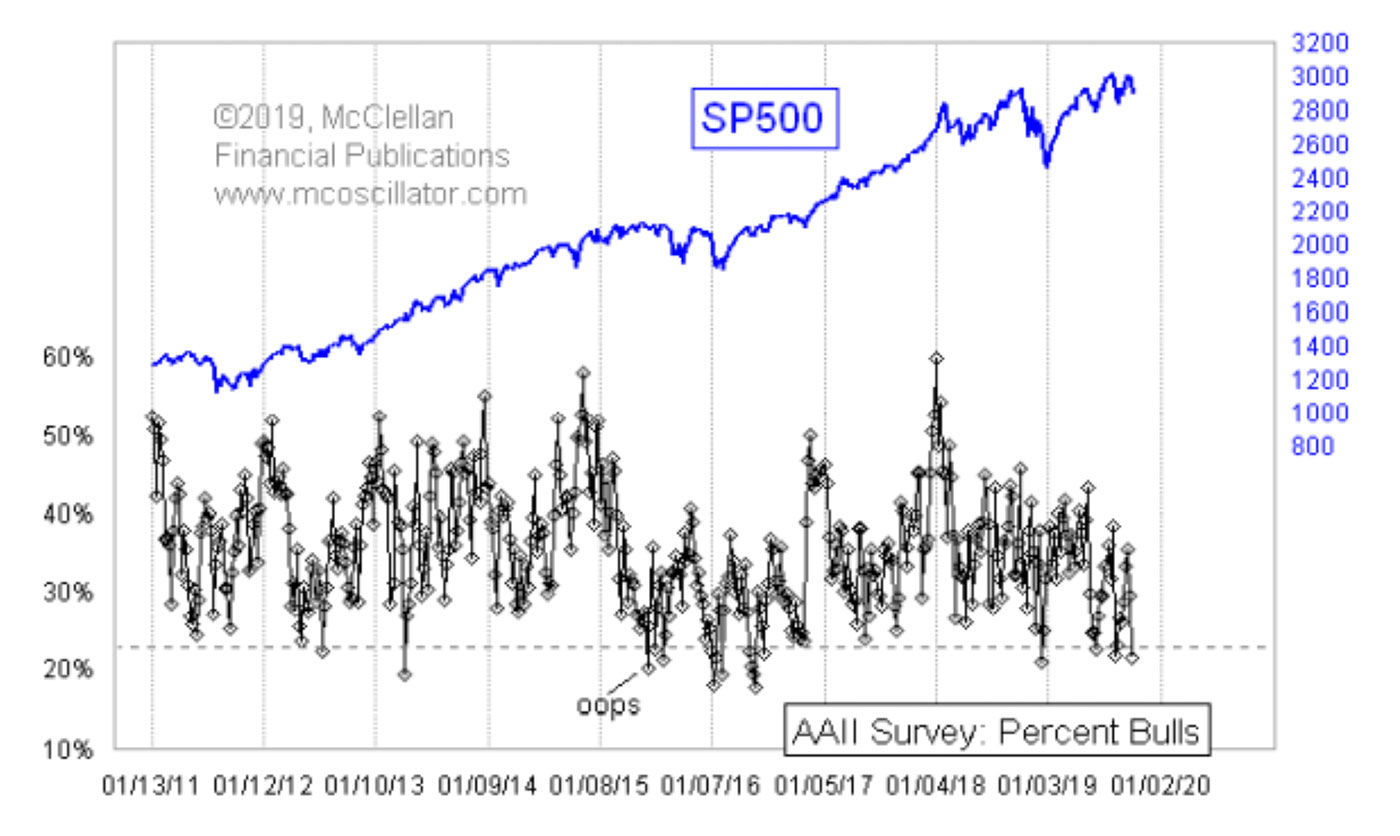
Source: McClellan Financial Publications, AAII
Last week’s 21% reading is among the lowest of the last several years. Most of the time, a very low reading like this will be a good marker of a price bottom. That does not always work, however, as an episode in mid-2015 demonstrates, noted in Figure 2.
Figure 3 takes a look at just the bears.
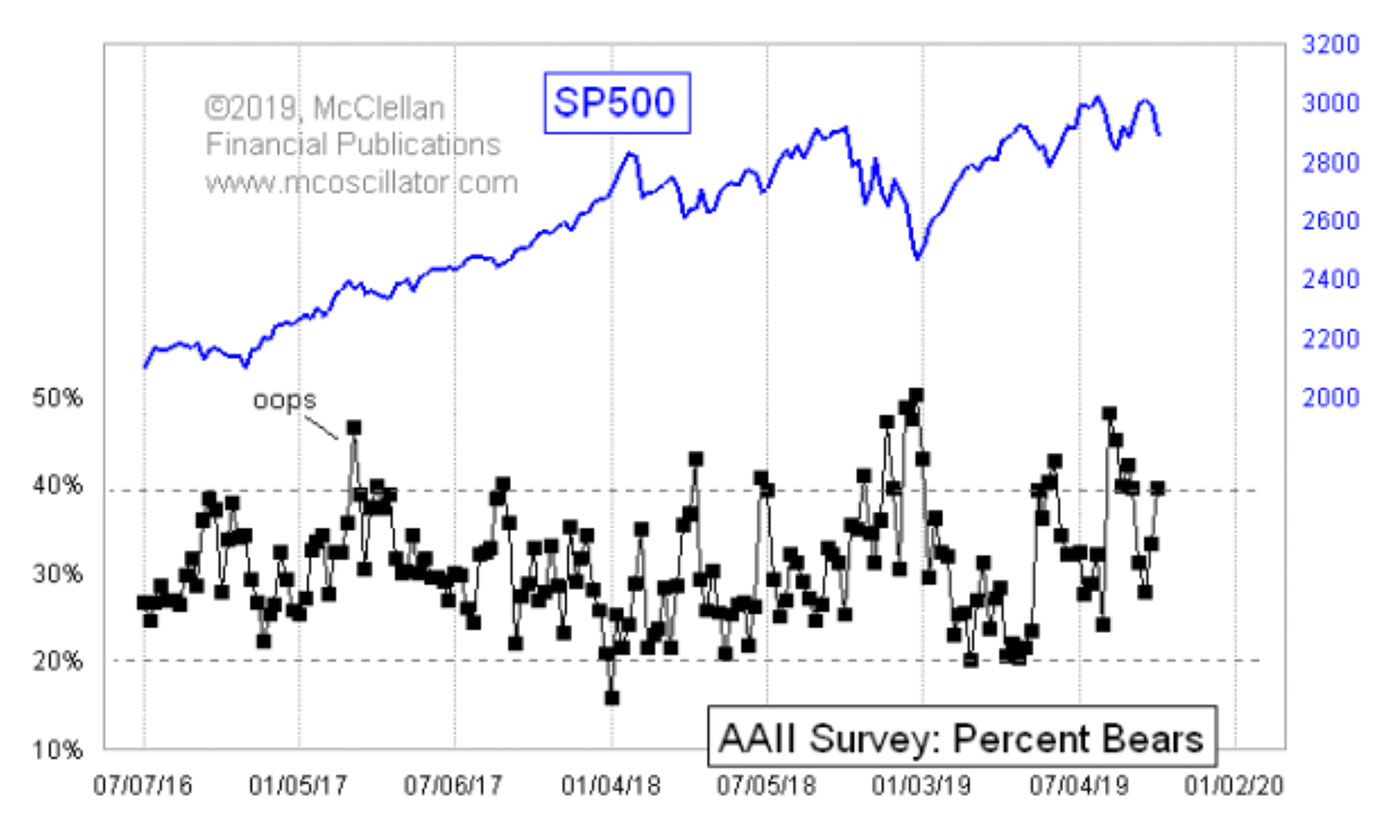
Source: McClellan Financial Publications, AAII
In this case, readings of around 40% or higher make for pretty good bottom indications, although there can be exceptions. We saw this in March 2017, with an anomalous 46% bearish reading that did not bring a bottom.
There is one additional way I like to look at these numbers, which is to see a very sudden shift in the bull-bear spread. I do that with a two-week change, as shown in Figure 4.
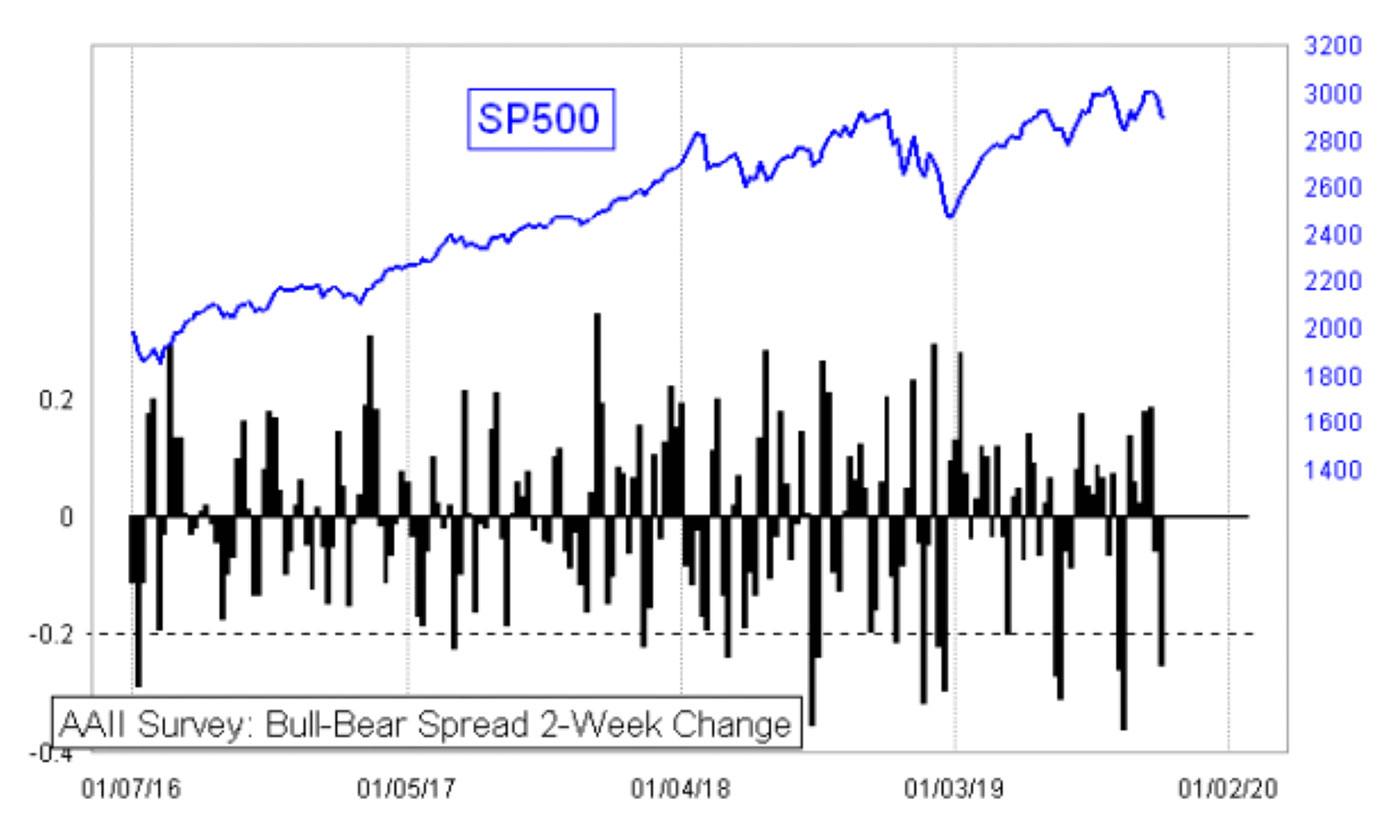
Source: McClellan Financial Publications, AAII
Note that this is not the same as a %ROC (rate of change) indicator you might use in a stock’s price. Rather, it is the raw numerical change in the spread, since we are already dealing with percentages. I have drawn a dashed line at the -0.2 level, which means minus 20 percentage points. Readings below there tend to mark pretty good bottom indications for equity prices.
So here we are in the scary month of October, just following the scary month of September. Investors are following the script pretty well by saying that they are scared. Right on time for a nice seasonal bottom.
 Tom McClellan is the editor of The McClellan Market Report newsletter and its companion, Daily Edition. He started that publication in 1995 with his father Sherman McClellan, the co-creator of the McClellan Oscillator, and Tom still has the privilege of working with his father. Tom is a 1982 graduate of West Point, and served 11 years as an Army helicopter pilot before moving to his current career. Tom was named by Timer Digest as the #1 Long-Term Stock Market Timer for both 2011 and 2012. mcoscillator.com
