
A passive core is not enough
A passive core is not enough

A multi-strategy core approach to portfolio construction addresses the issues present with other methodologies, which include a lack of consideration of risk, the loss of diversification benefits during crisis periods, and risk concentration in single strategies.
The most important part of an investor’s portfolio is the core. Morningstar puts it this way: “‘Core holding’ and ‘exciting’ don’t go together. But what core holdings lack in thrills, they make up for in importance. A core holding is just what it sounds like: It’s the central part—or maybe even the only part—of your portfolio. The core requires investments that will be reliable year in and year out. They’re the solid foundation for the rest of a portfolio.”
In practice, most portfolios constructed by financial professionals recognize this and allocate more than half of a client’s investment dollars to a core portfolio and the rest to various “satellite” or “explore” investments. This is usually accomplished with either index mutual funds or exchange-traded funds (ETFs); however, it can also be done with actively managed varieties of the same.
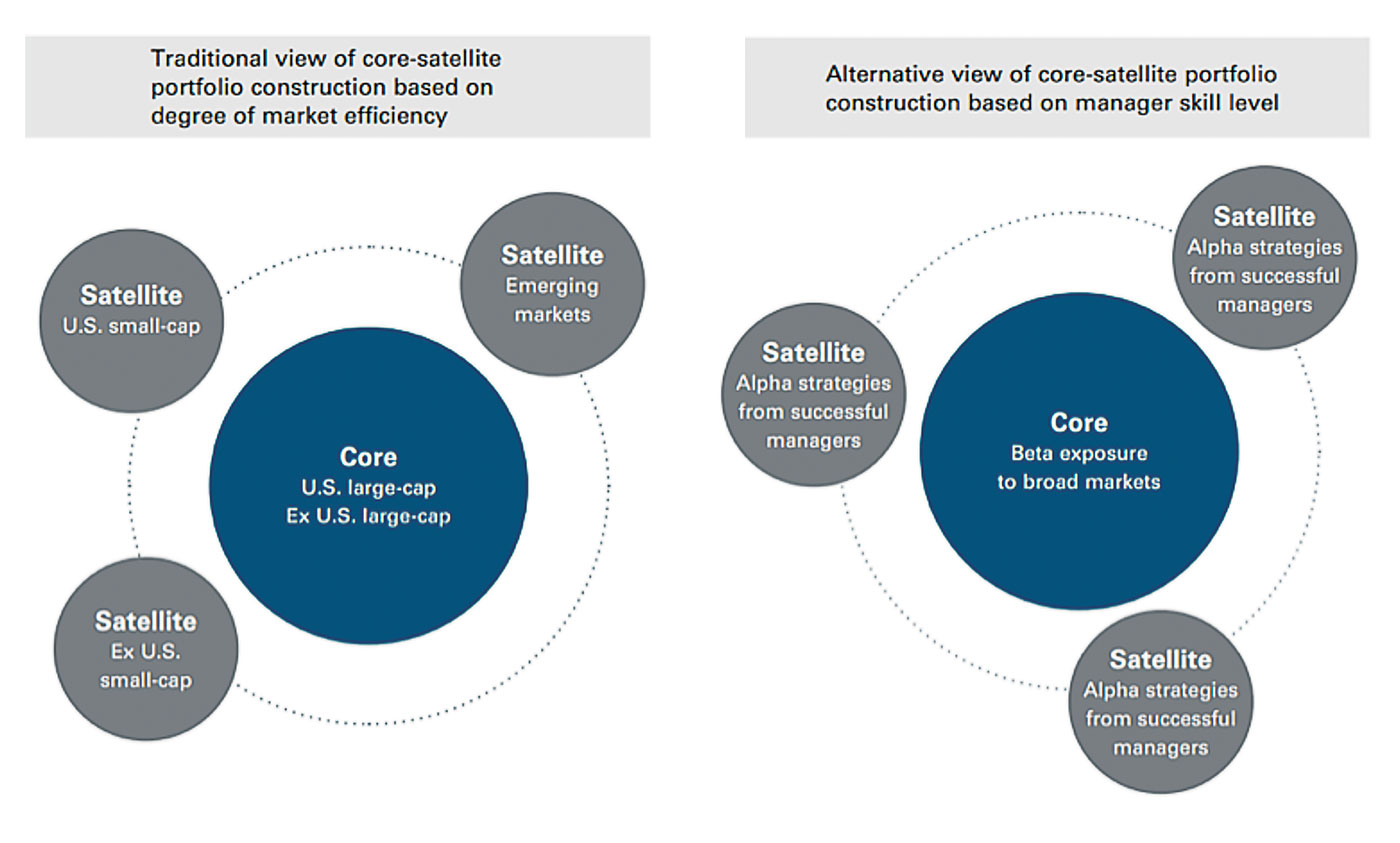
Source: Vanguard. 2010. “Building a global core-satellite portfolio.”
The selection of explore and/or satellite investments is beyond the scope of this paper. As for the core, we can state that there are two key goals for a core portfolio:
- It should provide beta (return) exposure to asset classes that have provided positive investment returns over the long haul (multiple decades).
- It should lower the risk of holding the equities (the top-returning asset class over the last 120 years).
The first goal is achieved by the careful selection of the included asset classes. The second has historically been sought after by the use of diversification. Yet, over time, we have seen that diversification is not enough.
Source: Charles Schwab Investment Advisory Inc. and Morningstar Direct
Financial advisors and their clients have learned firsthand that while diversification was once achievable during bear markets, in more recent crisis periods, it has failed them when they needed it most.
To achieve the two goals of a core portfolio, a methodology must be employed (1) to choose the assets for inclusion in the portfolio and (2) to achieve the desired risk reduction over the dramatic losses experienced by buy-and-hold investors in equity bear markets.
It is the underlying premise of this paper that there are multiple ways to achieve these goals.
The methodologies available to construct the essential core portfolio are limited only by the imagination of practitioners. In this paper, we will explore core construction methodologies across the spectrum, from passive to enhanced active approaches to portfolio management.
Since the introduction of mean-variance optimization in the 1950s, advisors have thought of portfolio management as a simple exercise of applying its principles and creating the ubiquitous pie chart of investment asset classes. Yet the conventional mean-variance, passive portfolio is just one approach available to financial advisors. Today there are so many styles of portfolio management that they create a whole spectrum of portfolio construction opportunities.
We define the spectrum of portfolio management as a scale between passive and active management, visually represented by Figure 3. In this paper, we will discuss each type of portfolio management along the spectrum, highlighting the advantages, issues, and potential solutions of each.

Source: Flexible Plan Investments Research
For this study, we use the universe in Table 1 for our traditional strategic asset-allocation examples. Our study period is from January 3, 2000, to April 30, 2019. A 1.6% fee is included in all “active balanced” and “enhanced active balanced” examples, which assume the use of hypothetical results of strategies using proprietary funds and the application of appropriate fee credits.
No fee is applied to “passive” and “enhanced passive” examples. Although practitioners using passive strategies likely charge fees, they vary widely. Similarly, expense ratios and taxes are not addressed as they also vary and may be minimized by the advisor in many different ways. Quarterly rebalancing is employed in all of the studies with the exception of our Multi-Strategy Core (enhanced active), which is more active in nature and rebalances monthly.
For the cases that do not use hypothetical results of strategies employing proprietary funds, the diversified universe of Lipper Fund Indexes shown in Table 1 is used. These indexes are used to reflect the reality of having to invest in funds to implement any strategy. Indexes are not investable without some cost. Using no-load mutual fund indexes eliminates the trading cost that would be incurred with ETF investments, and it extends the available history of the elements necessary to represent a diversified portfolio over multiple market cycles (which include the bear markets beginning in 2000 and 2007). See the full white paper for more details on our methodology.
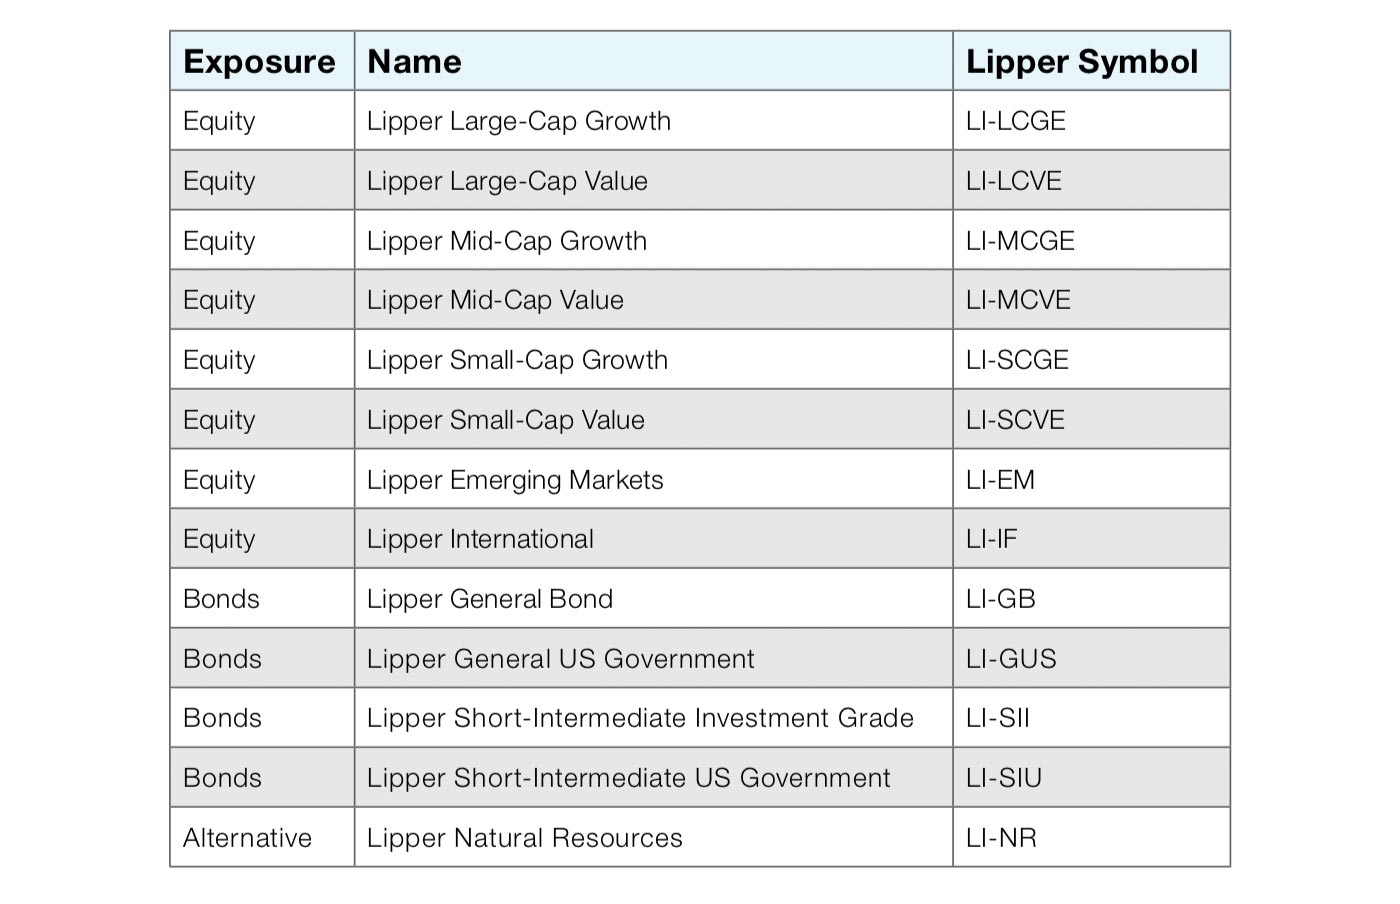
Source: Flexible Plan Investments Research
This is the easiest method, but how much does it consider risk?
On the far left of the spectrum of portfolio management (Figure 3) is “passive.” This methodology uses no weighting optimization and is often called “1/n” naïve diversification or “equal weight.” An example of the quantitative results of creating a diversified portfolio using such an approach is shown in Figure 4.
Advantage
Investing among various asset classes usually achieves risk reduction via diversification. It is easy to equally weight to each fund within the universe and rebalance periodically.
Issues
Equal weight does not consider the risk of the individual assets within the portfolio universe. For example, say Fund A within the portfolio has a risk of 30% and the others have a risk of 10%. Even though Fund A contributes three times as much risk as the other funds, this approach gives them all equal weight within the portfolio.
Analysis
Passively equally weighting the universe from Table 1 produces the results shown in Figure 4.
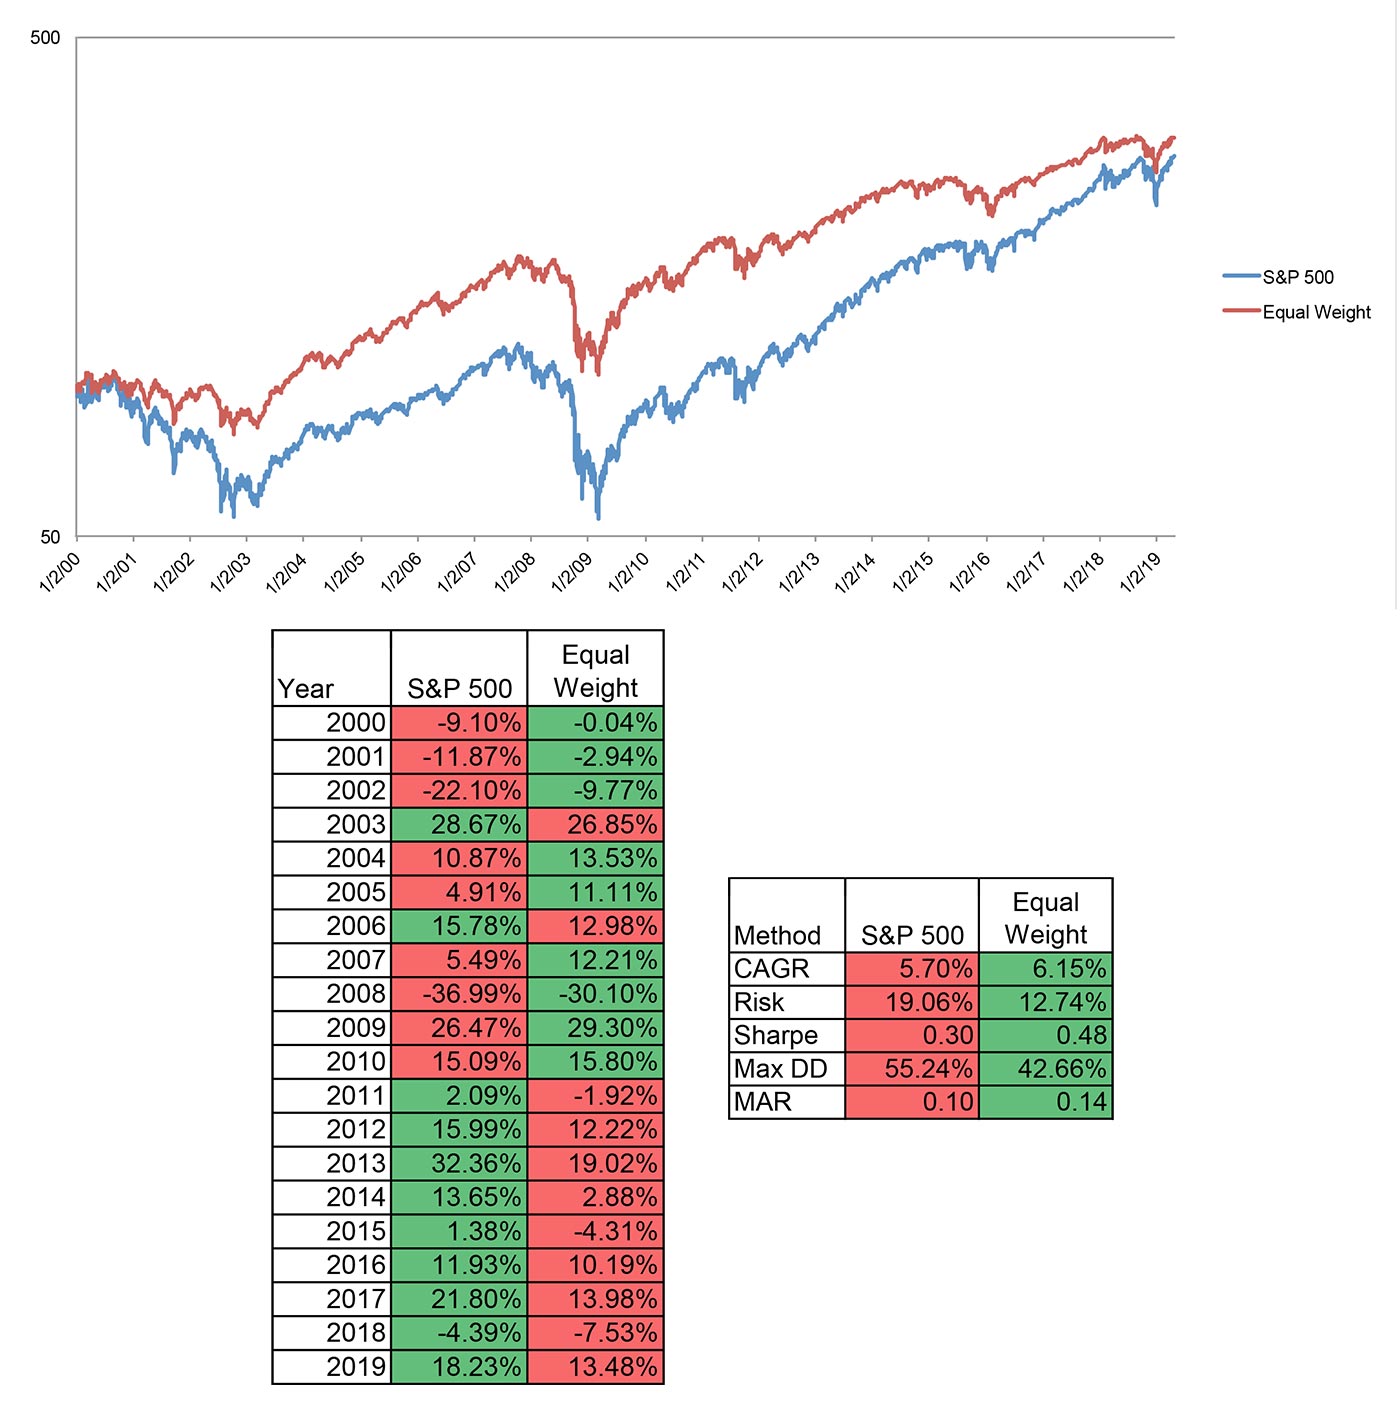
Source: Calculations are by Flexible Plan Investments Research. Returns are hypothetical and backtested. The chart in this figure uses a logarithmic scale. See white paper for further notes on methodology.
In this case, passively investing in a diversified universe results in reduced risk and drawdown when compared to a portfolio that is concentrated in the S&P 500. Despite the perceived benefits of passive portfolios, they are still susceptible to extreme market fluctuations resulting in equity-like drawdowns of more than 42% during the maximum drawdown period.
These approaches consider risk, but should diversification be your only risk-management tool?
Enhanced passive asset allocation introduces a weighting component to the portfolio-management process. We present three common approaches used within the investment-management industry: Markowitz mean-variance optimization, risk parity, and balanced funds.
Markowitz mean-variance optimization
Markowitz mean-variance optimization is based on the premise that investment opportunities can be measured in terms of mean return and variance of return. The optimization process weighs risk (variance) against expected return. The tangency portfolio is the asset-allocation portfolio that has the lowest risk for a given level of return (Figure 5).
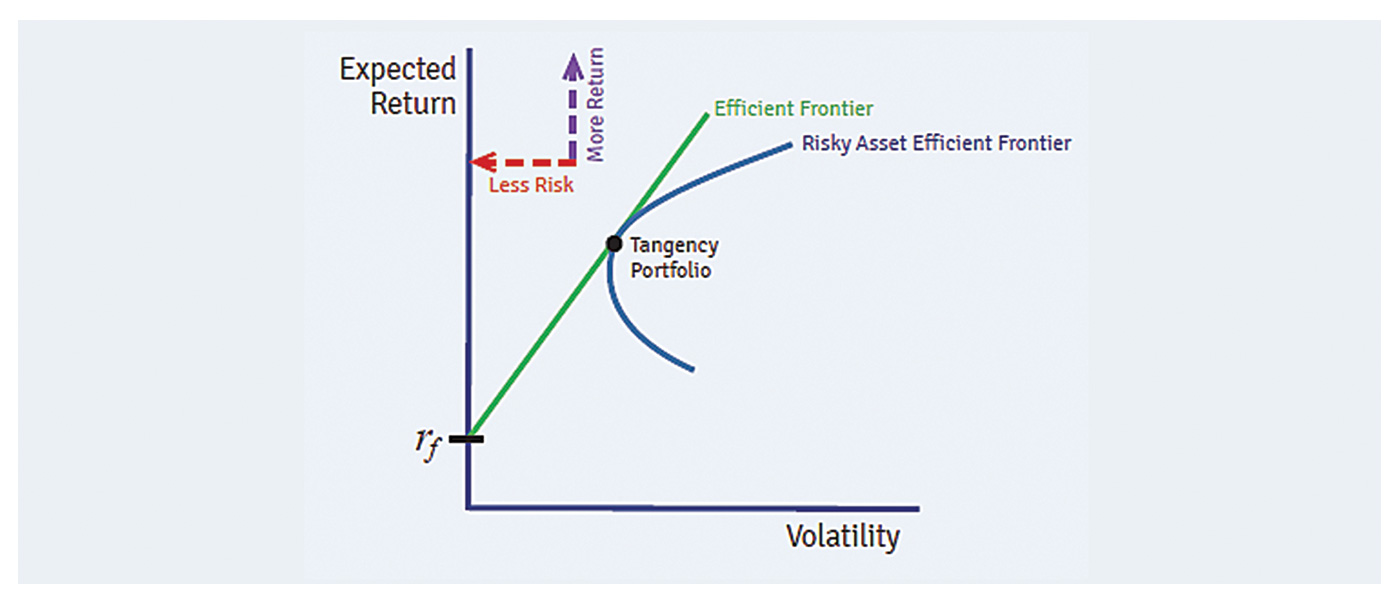
Source: P. Hecht, “Evaluating Hedge Funds—Alphas, Sharpe Ratios & the Underappreciated Appraisal Ratio,” Hedge Fund Insight, Dec. 18, 2014.
Adherents to the technique, which is also known as modern portfolio theory, believe that one can diversify away unsystematic risk by reducing the correlation between the returns from the securities in the portfolio. Simply put, having lower correlation between assets in a portfolio helps protect against losses given the theory’s assumption that not everything will go down in tandem with the same severity during drawdown periods in the markets.
In this study, we optimize weights quarterly and use a 10-year rolling lookback for mean and variance input calculations. We target a balanced portfolio using assets from Table 1 on the efficient frontier for mean-variance optimization. We are not using the tangency portfolio since it is “bond-like” due to its goal of maximizing return per unit of risk across the frontier. We also include the Lipper Balanced Index and the commonly used Vanguard Balanced mutual fund for comparison throughout this section. Balanced funds are a real-world implementation of enhanced passive methods. For that reason, we have included the results of funds based on their precepts.
Risk parity
Risk parity, like mean-variance optimization, addresses the risk issue that arises with equal-weight diversification—but does so using a different method. Mean-variance optimization finds the optimal mix of assets based on their expected returns, risks, and correlations to each other. Risk parity focuses only on equalizing the risk contributions of each asset, without considering expected returns.
Comparison of enhanced asset-allocation methodologies
The chart on the left in Figure 6 shows the resulting weights of a mean-variance optimized portfolio using the universe from Table 1. It is diversified by asset class; however, because it is weighted using mean-variance optimization, risk is not equalized. The allocations viewed by the risk of each asset within the portfolio are presented in the chart on the right in Figure 6.
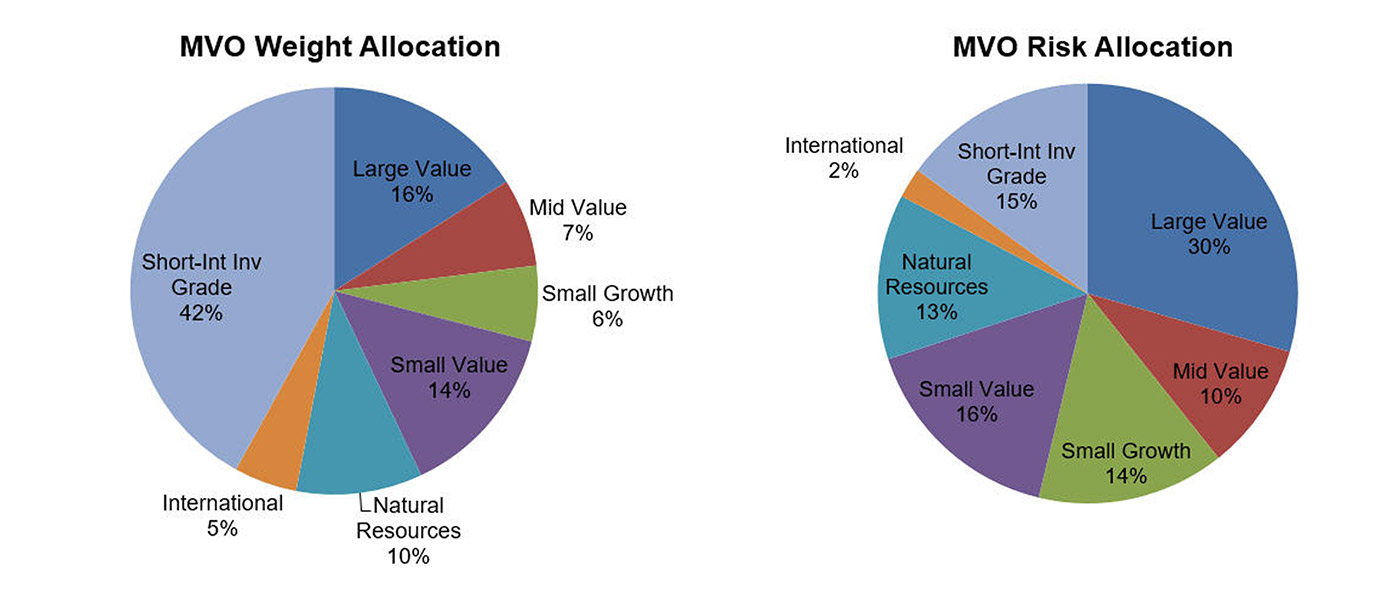
Source: Calculations are by Flexible Plan Investments Research. Returns are hypothetical and backtested. You cannot invest in an index. See white paper for further notes on methodology.
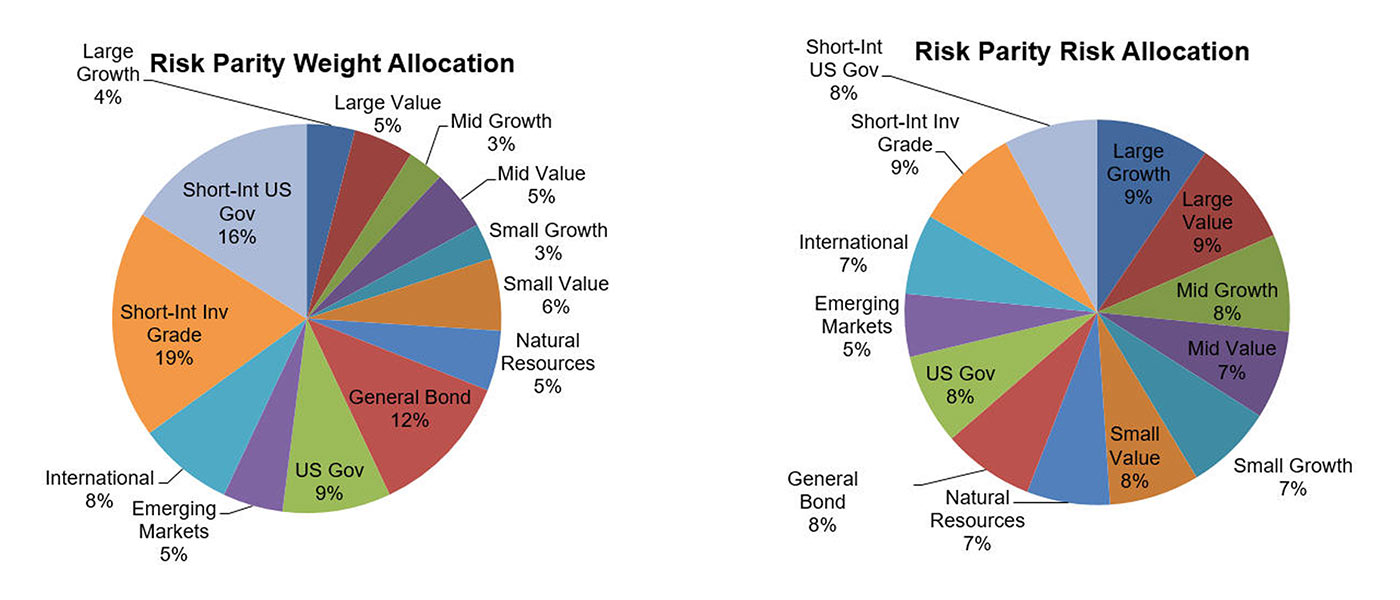
Source: Calculations are by Flexible Plan Investments Research. Returns are hypothetical and backtested. See white paper for further notes on methodology.
It is evident from the charts that while the risk-parity approach equally distributes the risk, it typically results in an overweighting to low-risk assets. This results in lower risk than a traditional portfolio of diversified asset classes—but also lower return. This happens because, in order to equalize risk, the lowest-risk asset (theoretically, also the lowest return) must be overweighted to achieve equal risk within the portfolio. In practice, leverage may be used to make the return or risk of the lower-risk asset classes equal to the level of risk appropriate for the client based on a suitability assessment. For the purpose of this study, we do not employ leverage to highlight how the approach handles drawdowns and risk.
Advantages of enhanced passive allocation
Markowitz mean-variance optimization and risk parity both address the area where equal-weight diversification can fall short: its failure to consider the risk of assets in the portfolio-allocation decision. Each handles it differently, and each is readily available for creating core strategies using asset allocation.
Issues
Markowitz mean-variance optimization
The Markowitz mean-variance optimization theory makes a number of assumptions that do not apply to the real world of investing, including the following:
- The level of return is always directly related to the level of risk undertaken.
- Expected returns for all assets are known and persistent.
- The variance and covariance of all asset returns are known and persistent.
- There are no transaction costs or taxes.
- Mean returns and variance are stationary.
The CFA Institute lists the following six criticisms of mean-variance optimization:
- The outputs (asset allocations) are highly sensitive to small changes in the inputs.
- The asset allocations are highly concentrated in a subset of the available asset classes.
- Investors are often concerned with characteristics of asset-class returns such as skewness and kurtosis that are not accounted for in mean-variance optimization.
- While the asset allocations may appear diversified across assets, the sources of risk may not be fully diversified.
- Mean-variance optimization allocations may have no direct connection to the factors affecting any liability or consumption streams.
- Mean-variance optimization is a single-period framework that tends to ignore trading/rebalancing costs and taxes.
To address some of these criticisms and present the enhanced passive testing with an added layer of stability, we perform our optimization on a walk-forward basis quarterly using a 10-year lookback.
Another issue with mean-variance optimization is that an investor’s allocation will depend greatly on the time period used to estimate the input variables. Figure 8 reflects third-party, multi-decade research, demonstrating the instability of the efficient frontier decade by decade. As the figure shows, the frontiers look very different over the seven, decadelong time periods. If a financial advisor had optimized based on the previous decade, in most cases, the investor client would likely be disappointed with the results when compared with those of the current decade’s efficient frontier.
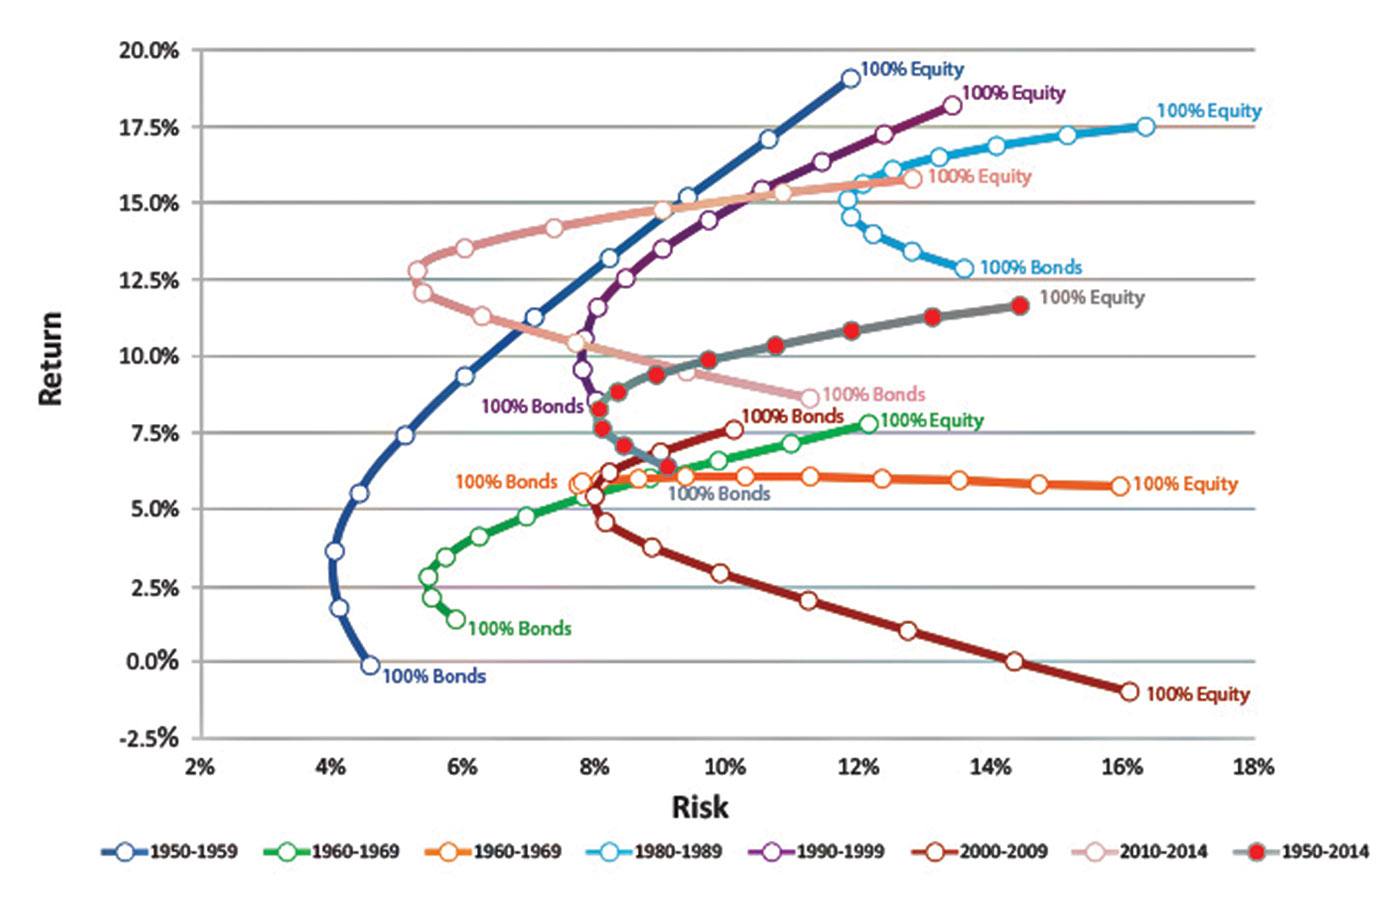
Sources: Rydex Investments, Flexible Plan Investments Research
Risk-parity asset-allocation concerns
The main issue with risk parity is that it results in a portfolio with large weighting exposures to low-risk assets. Risk parity focuses too much on equalizing risk and not enough on return. In practice, risk parity is often used by hedge funds with leverage to match the portfolio to the desired degree of risk and return.
Investment & Pensions Europe highlights the following problem associated with risk parity:
In terms of performance for the typical investor, Jonathan Cooper, a contributor to Seeking Alpha, points out that portfolios will end up overweighting bonds, which over time will produce returns that are not on par with a typical passive 60/40 allocation.
Warning: Diversification is the only risk-management tool
A substantial problem with both mean-variance optimization and risk parity is that they only make use of one risk-management tool: diversification. Diversification is the first line of defense when it comes to managing investment risk. Unfortunately, it may not be enough for all situations, especially in times of crisis.
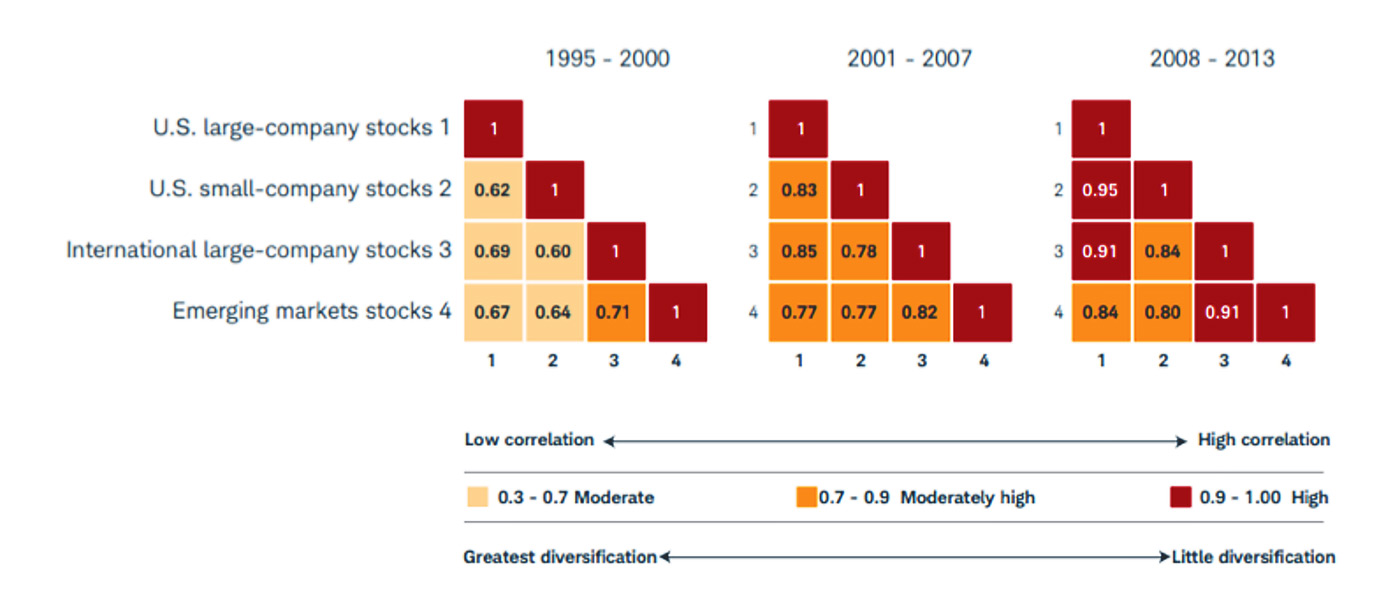
Studies show asset correlations tend to go to +1 in crisis periods. According to an article published by investment manager Two Sigma, “For all four asset classes [equities, fixed-income, commodities, alternatives], correlations spiked at the onset of the financial crisis in late-2008 after a decade of relative stability. Pairwise equity correlations reached nearly 70 percent from a pre-crisis level of approximately 40 percent.”
This tendency, commonly known as “crisis correlation,” can be modeled separately. Over long periods of time, low correlations exhibit diversification benefits. During times of market crisis, the correlation benefit isn’t the same because asset correlations increase.
To appreciate this, we compared the asset-class correlations during drawdown periods for the S&P 500 (referred to as “Bad” market environments in the following figures and tables) to the correlations for the same number of days as the drawdown period before the start of the drawdown (referred to as “Good” market environments). Figure 9 shows the start and end for each of these environments since the late 1990s, as well as the number of days studied in that environment.
FIGURE 9: “GOOD” AND “BAD” MARKET ENVIRONMENTS SINCE THE LATE 1990s
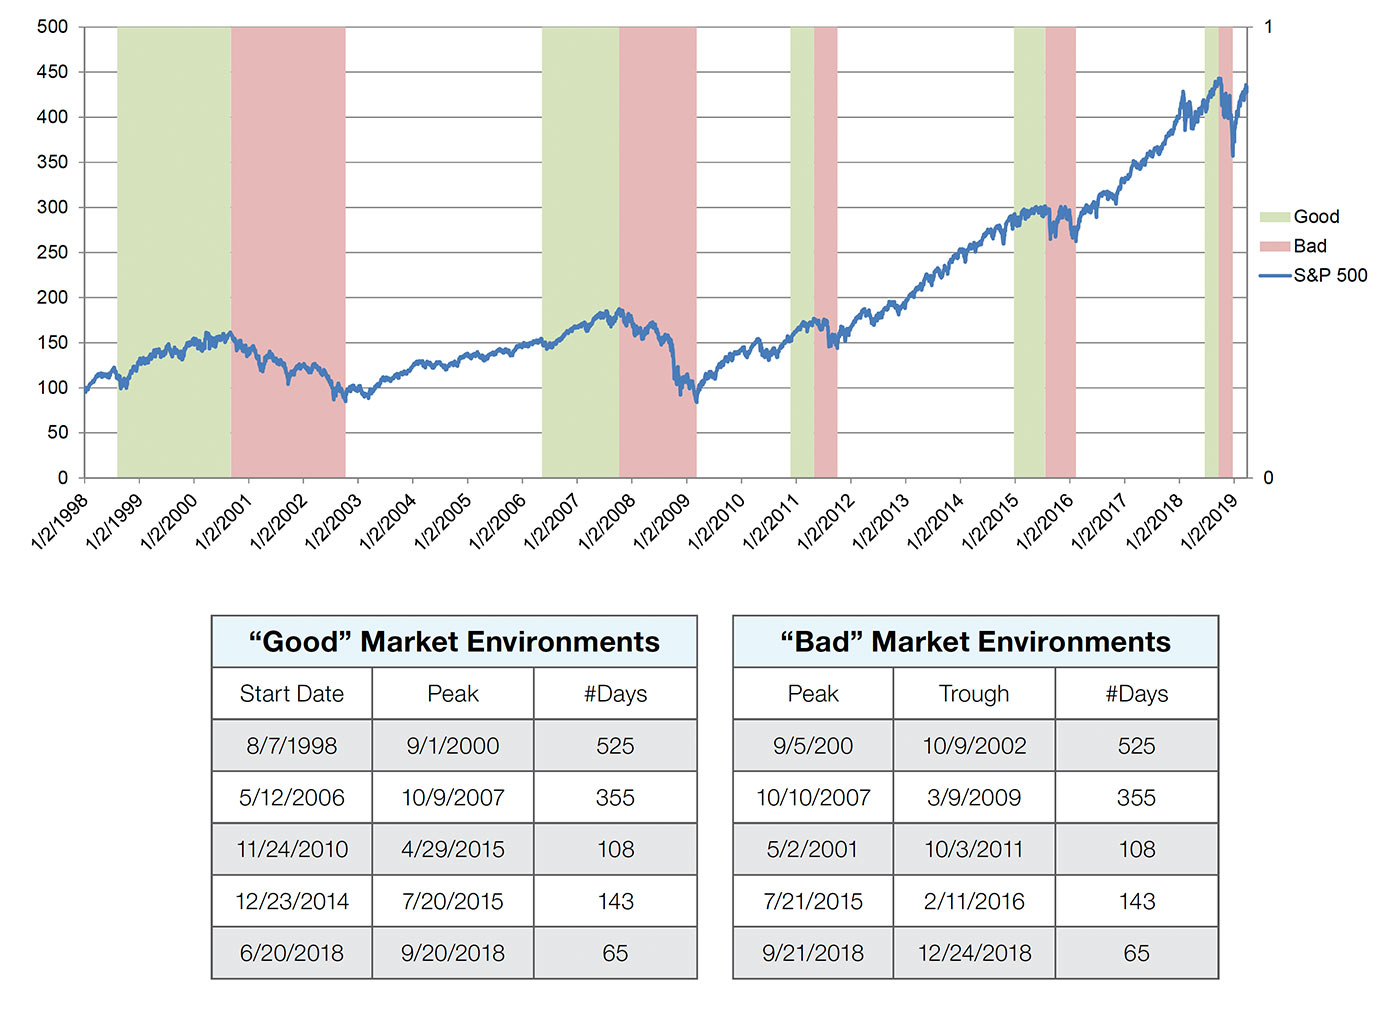
Source: Flexible Plan Investments Research
For brevity, Tables 2 and 3 show the correlations between the asset classes during the most recent period illustrated in Figure 9—first in the “good” environment followed by the related “bad” environment using the asset classes from the Table 1 portfolio. Correlations that become more positive, closer to +1 between assets, are shaded red during the “bad” environment. Green highlighting signifies that the correlations became less positive during the period.
During the most recent bad environment, emerging markets, international, some fixed-income exposure, and natural resources all experienced an increase in correlations during the fourth quarter of 2018. Yet these are precisely the asset classes that the enhanced passive methodologies would have invested in to achieve risk diversification.
Results for the other time periods in Figure 9 are shown in the Appendix. In each set of good and bad environments, we see the same pattern play out: Correlations between asset classes increase during each of the bad environments. In other words, it is not likely that the diversification would have reduced risk when an investor needed it to the most—namely, in a crisis.
What is very concerning is the increase in correlation between equities and short-term bonds that we see in both the 2011 and 2015 bad environments. If this increase were to occur during the next major bear market (which could occur in a rising-rate environment instead of the declining-rate environment of the last 20 years), it could be disastrous for a strategically allocated asset-class portfolio.
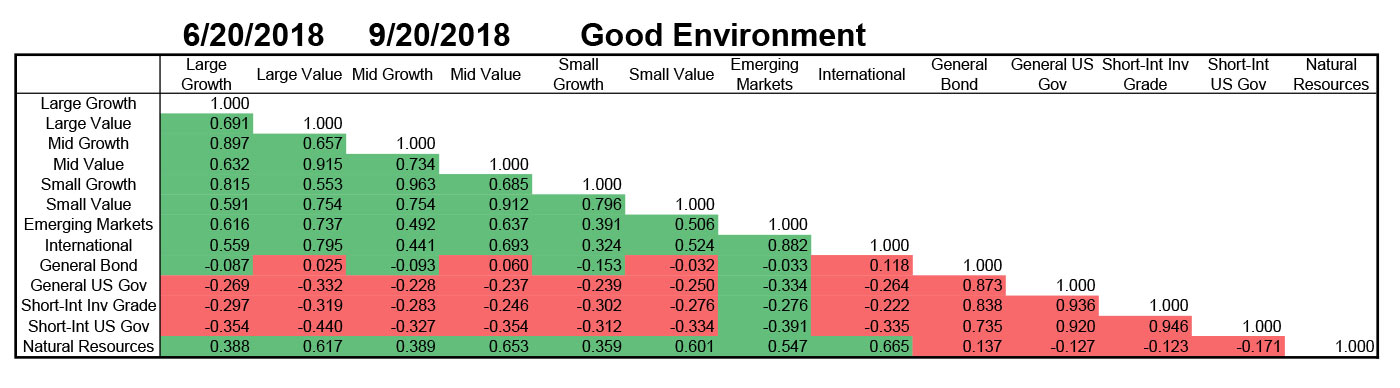
Source: Flexible Plan Investments Research
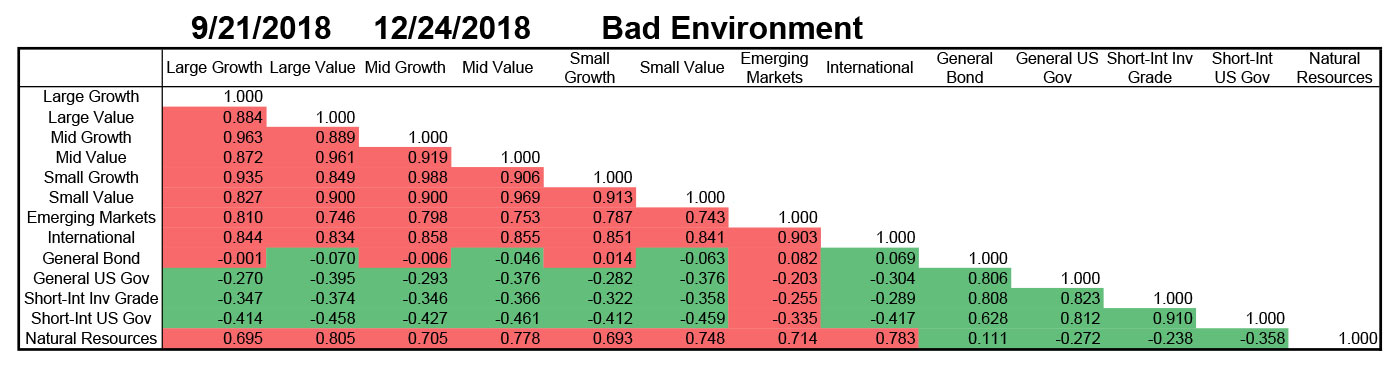
Source: Flexible Plan Investments Research
Comparing the results of an equal-weight investing approach to an enhanced passive approach as represented by Markowitz mean-variance optimization (targeting a 60/40 balanced allocation risk) and risk parity produces the results in Figure 10 using the universe from Table 1.
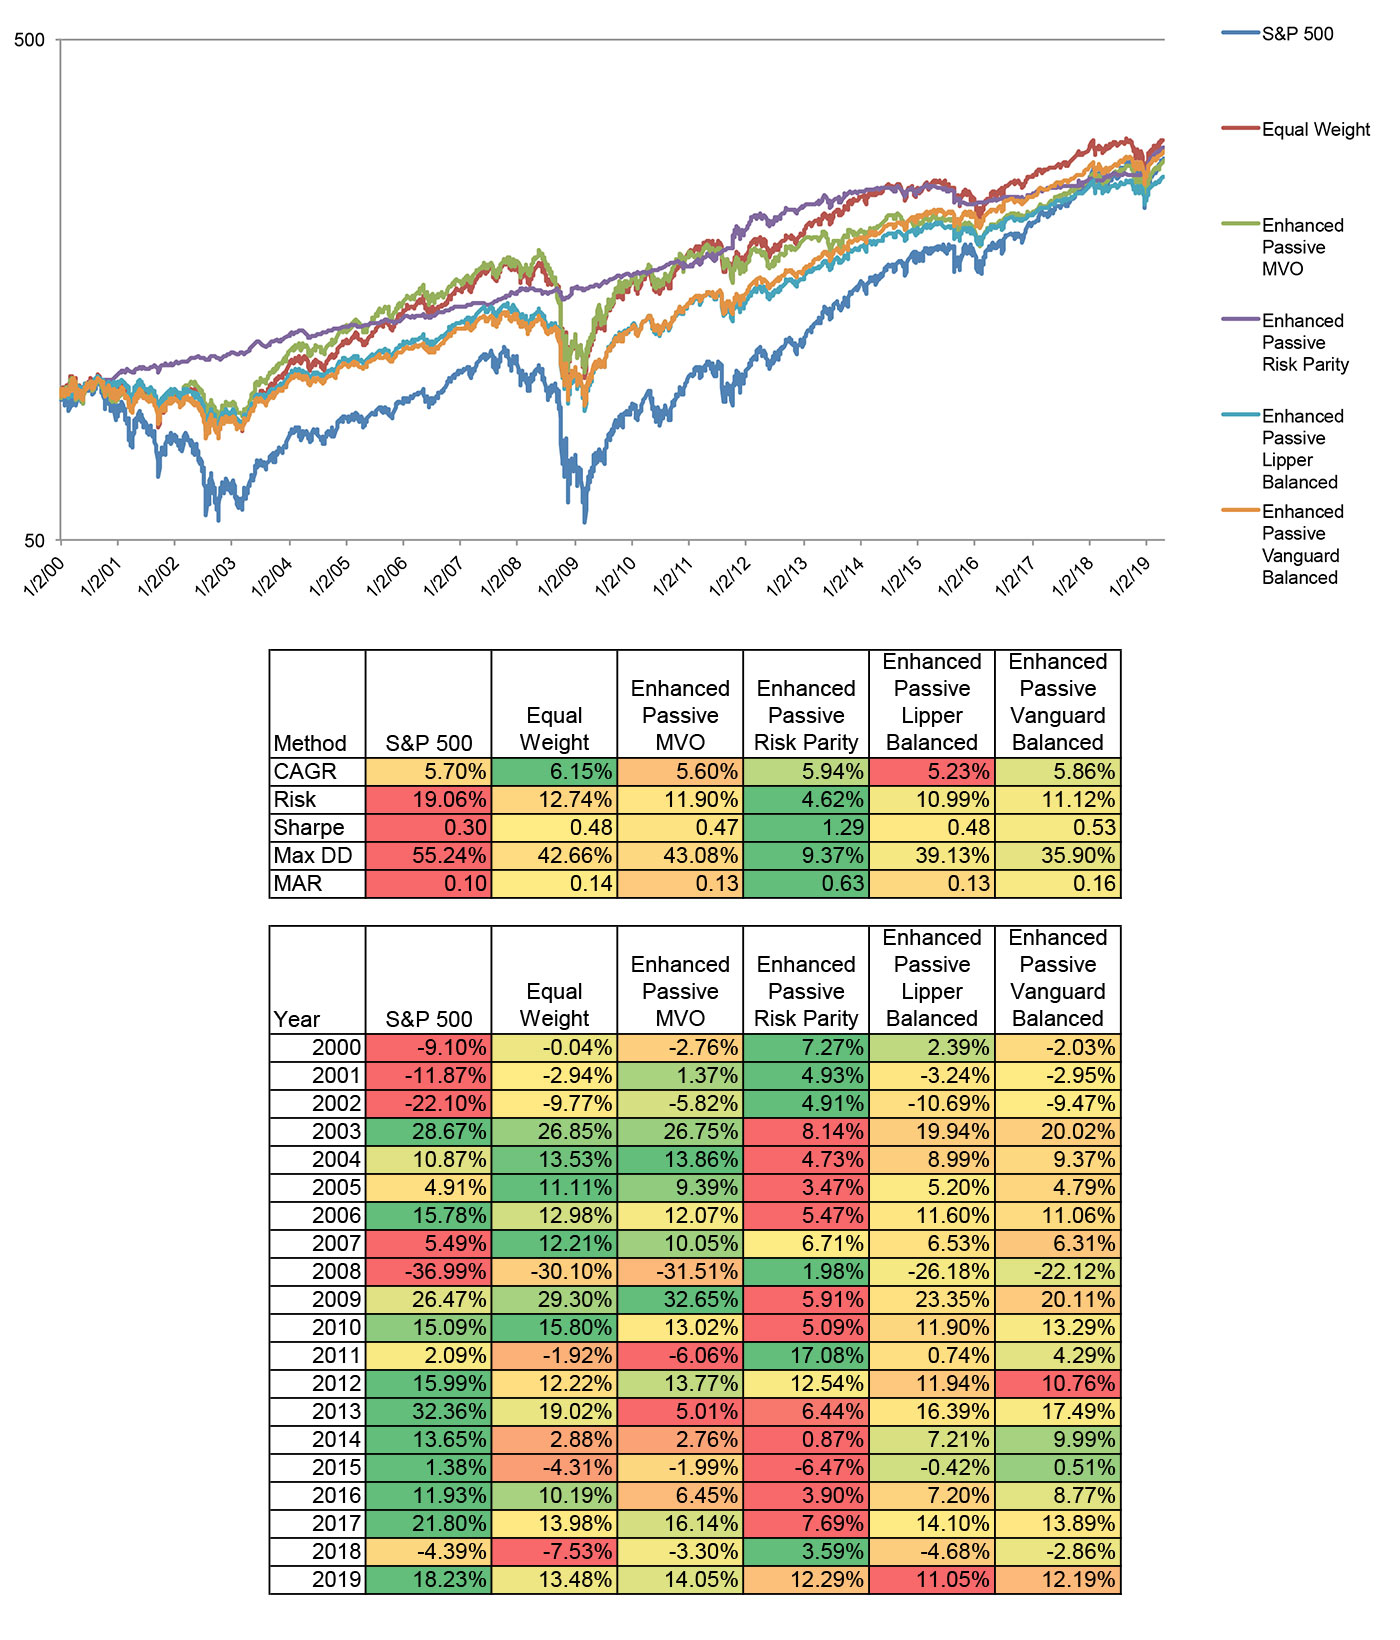
Source: Calculations are by Flexible Plan Investments Research. Returns are hypothetical and backtested. The chart in this figure uses a logarithmic scale. See the complete white paper for further notes on methodology.
Figure 10 demonstrates the power of simple equal-weight investing. By ignoring risk, it outperforms, simply on a return basis, all other options (including the return of the S&P 500). But its disregard for risk causes it to generate drawdowns almost as great as the unmanaged S&P 500 Index. Still, the Sharpe ratio and MAR measures of risk-adjusted return for the passive index are higher than the unmanaged index.
Traditional mean-variance optimization is the most often used method by financial advisors, yet it fared the worst in this study. It has the lowest return and experiences a drawdown comparable to equal-weight investing and the unmanaged index. As the focus of modern portfolio theory is superior risk-adjusted return, it is worth noting that mean-variance optimization does exceed the unmanaged index (though not the equally weighted portfolio) on these measures.
Risk parity performs significantly better than the other methodologies. Although falling short of equal weighting in the return measurement, it achieves a better return than the S&P 500 unmanaged index while generating clearly superior results for risk and risk-adjusted return.
Unfortunately, the methodology achieves its results based on just a few superior years. Most years, risk parity is the worst performer of the methodologies tested. This calls into question an investor’s ability to stick with the method during the multi-year stretches of subpar returns.
Given the active versus passive debate that exists in financial circles, it is interesting to note that the balanced fund benchmarks do provide equal or better risk and risk-adjusted return than the S&P 500 Index and the equal-weight portfolio. They do not, however, outperform the performance measures of the risk parity portfolio.
A passive core
is not enough
This two-part guest commentary
by Flexible Plan Investments explores
why investors should reconsider
the construction of their portfolios’ core.
Part II: Adding active management into
the portfolio-construction equation
Until now, we have applied established asset-allocation methodologies (equal weight, Markowitz, and risk parity) to passive asset-class investments (Lipper mutual fund indexes). In our next step, which will be presented in Part II, we apply these same routines to dynamically risk-managed mutual funds. This potentially provides two levels of risk management. The first would be within the “actively” managed funds. The second would be by allocating among the funds.
***
Part II will similarly examine in detail dynamically risk-managed portfolio approaches, identifying several significant advantages for financial advisors and their clients. Look for Part II in an upcoming issue of Proactive Advisor Magazine.
The opinions expressed in this article are those of the author and do not necessarily represent the views of Proactive Advisor Magazine. These opinions are presented for educational purposes only.
This article presents an excerpt from the white paper “A Passive Core Is Not Enough.” The complete paper—including a list of source data and disclosures—can be found here.
This white paper is provided for information purposes only and should not be used or construed as an indicator of future performance, an offer to sell, a solicitation to buy, or a recommendation for any security. Flexible Plan Investments, Ltd., cannot guarantee the suitability or potential value of any particular investment. Please see complete white paper for further disclosure information, appendix data, and notes on methodology.
Since 1981, Flexible Plan Investments (FPI) has been dedicated to preserving and growing wealth through dynamic risk management. FPI is a turnkey asset management program (TAMP), which means advisors can access and combine FPI’s many risk-managed strategies within a single account. FPI’s fee-based separately managed accounts can provide diversified portfolios of actively managed strategies within equity, debt, and alternative asset classes on an array of different platforms. FPI also offers advisors the OnTarget Investing tool to help set realistic, custom benchmarks for clients and regularly measure progress. flexibleplan.com