
6 market internals that can help avoid stock market risk
6 market internals that can help avoid stock market risk

Using a broad, diverse list of different metrics, known as market internals, can provide a comprehensive assessment of current market conditions—identifying warning signals, confirming a trend, or indicating a potential trend change.
One of my most important jobs is to frequently evaluate and re-evaluate the current level of stock market risk—because it’s always changing. One of the ways I do this is by closely tracking a short list of my favorite stock market internals.
I consider these stock market internals to be essential in managing portfolio risk because of how significantly the participation in the stock market has changed within just the past decade.
Specifically, 70% of overall daily trading volume is now generated by algorithmic trading. And, in my opinion, a lot of these “algos” are specifically designed to “push our buttons.” That is, they use our emotions against us—in a kind of financial jiujitsu—to do precisely the wrong thing at the wrong time, like buying at market tops and selling at market bottoms.
This is accomplished by large sums of algo-driven assets pushing key indexes, or influential stocks, back and forth through important key technical price levels that investors and the financial press are focusing on. These can include previous market highs or lows indicating resistance and support levels, technical trend lines, and popular moving averages.
Market internals can reveal what’s happening “under the hood” of various indexes by examining metrics such as investor asset flows, corporate bond spreads, trading volume, and market breadth, to name a few. Think of market internals as your trusted auto mechanic. After you pick out a sharp-looking car from the local used car dealer, you might wait to make the actual purchase until your mechanic checks out the engine and gives you the thumbs-up.
We make our favorite market internals easily accessible by prominently featuring them on our website, as displayed in Table 1, and update them every day. We call them the “Asbury 6.”
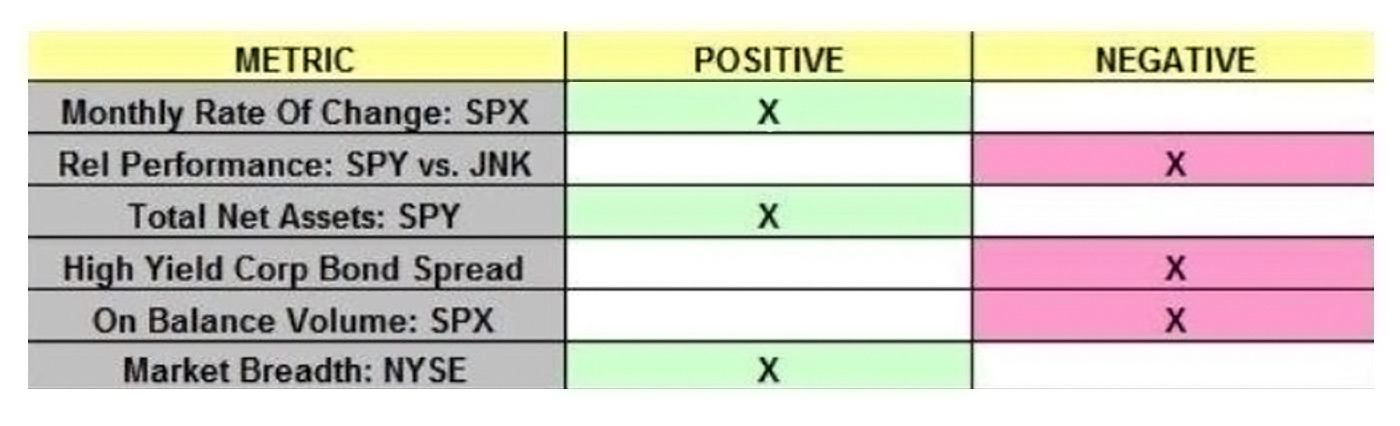
Note: SPX and SPY refer to the S&P 500 Index and SPDR S&P 500 Trust ETF, JNK is the SPDR Barclays Capital High Yield Bond ETF, and market breadth is based on data from the New York Stock Exchange (NYSE) Composite Index.
Source: Asbury Research LLC, based on data through 3/28/19.
The total net assets invested in an exchange-traded fund, or ETF, are one of just a few metrics we know of that actually lead price. This is because the inflow and outflow of investor dollars into any financial asset (indicating investor conviction) is the catalyst that actually pushes the price of the asset higher or lower.
The bars in the upper panel of Figure 1 plot the S&P 500 (SPX) on a daily basis from December 2018 through March 28, 2019. The blue line in the lower panel plots the corresponding daily total net asset invested in the SPDR S&P 500 Trust ETF (SPY, which tracks the S&P 500) along with its red 21-day moving average (MA). The 21-day MA represents one trading month and is the tactical time period we typically look at.
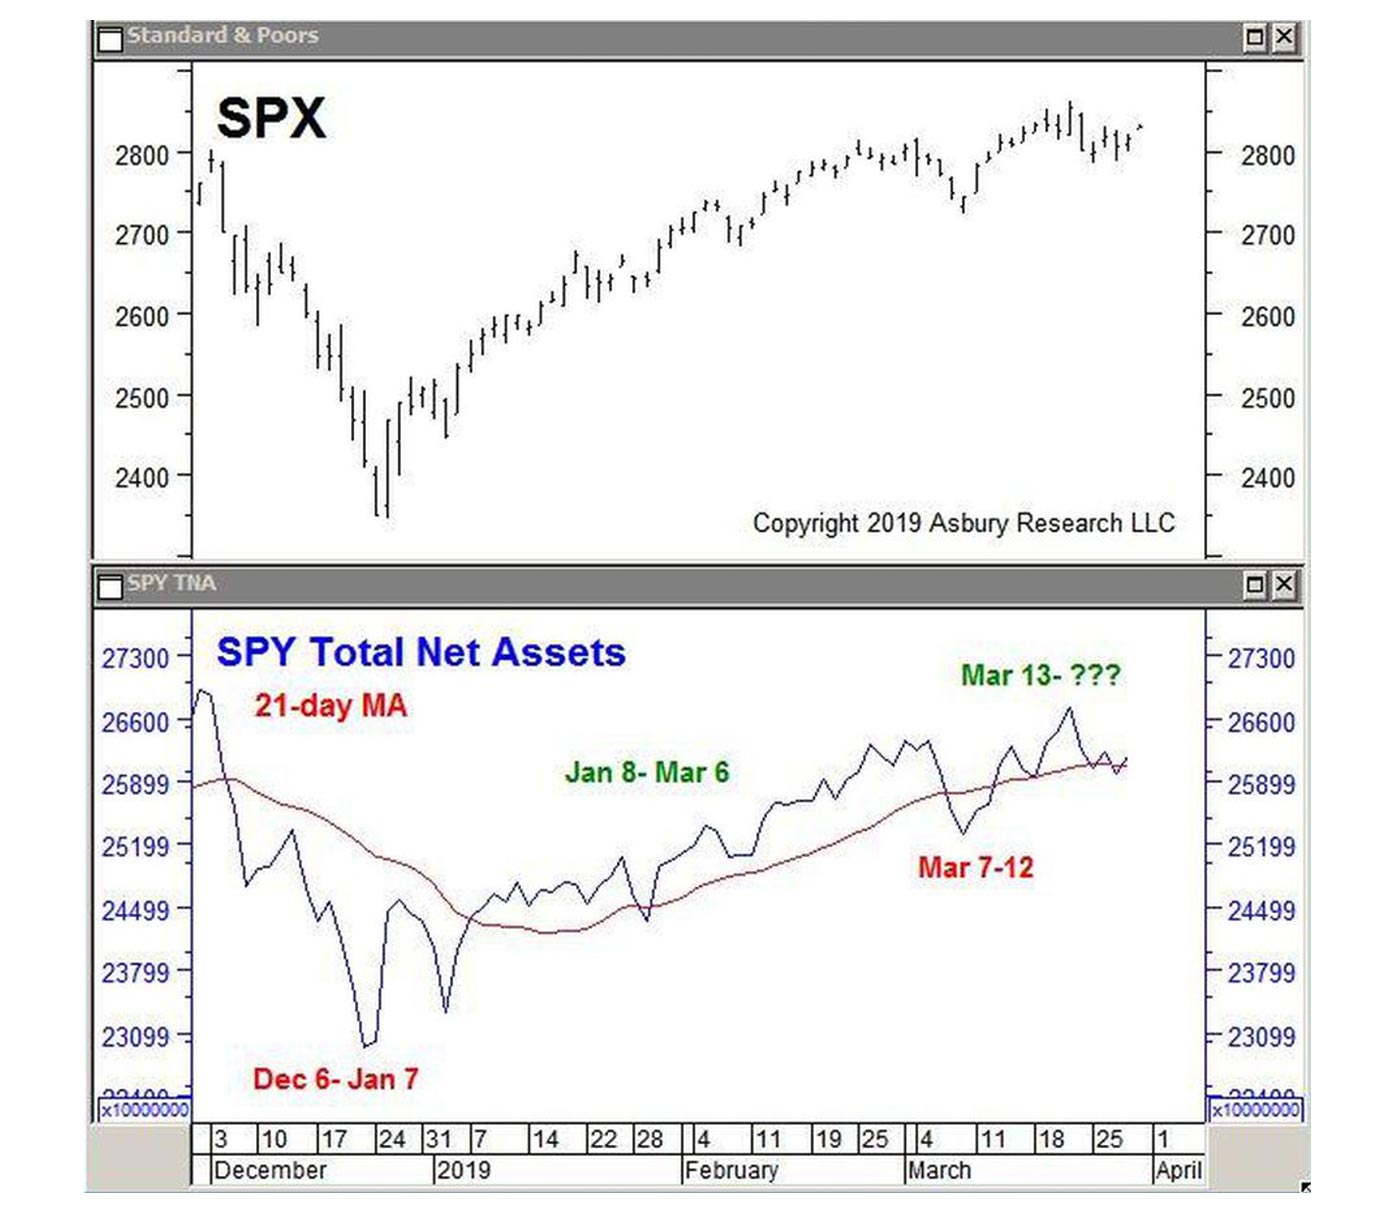
Source: Asbury Research LLC, data through 3/13/19.
The red text shows that the decline in assets below their 21-day moving average between Dec. 6, 2018, and Jan. 7, 2019 (which indicates a trend of monthly asset contraction), coincided with and likely triggered the 5% decline in SPX during that period. The green text shows that the subsequent rise in these assets above their 21-day moving average between Jan. 8 and March 29, with the exception of a short period between March 7 and 12, coincided with (fueled is perhaps more accurate) the 10% rise in SPX.
This metric identifies when investor assets are leaving the market, indicating a “risk off” situation, and when they are flowing into the market, indicating a “risk on” situation.
Market breadth expresses how many, or what percentage, of the constituents of a financial market index are rising in price. There are many different ways to analyze market breadth. One of our favorites, and one of the Asbury 6, is the ratio of advancing versus declining stocks in the NYSE Composite Index (NYSE), better known as the NYSE Advance/Decline (A/D) Line. The more constituent stocks that are rising within a particular stock index, the better the market breadth and the stronger and more sustainable the advance. Conversely, when more constituent stocks are declining, like when a relatively few larger-capitalization stocks are “holding the index up,” the more vulnerable the index is to a bearish reversal.
The black bars in the upper panel of Figure 2 plot the S&P 500 (SPX) on a daily basis since November. The bars in the lower panel plot the corresponding NYSE A/D Line along with its red 21-day moving average.
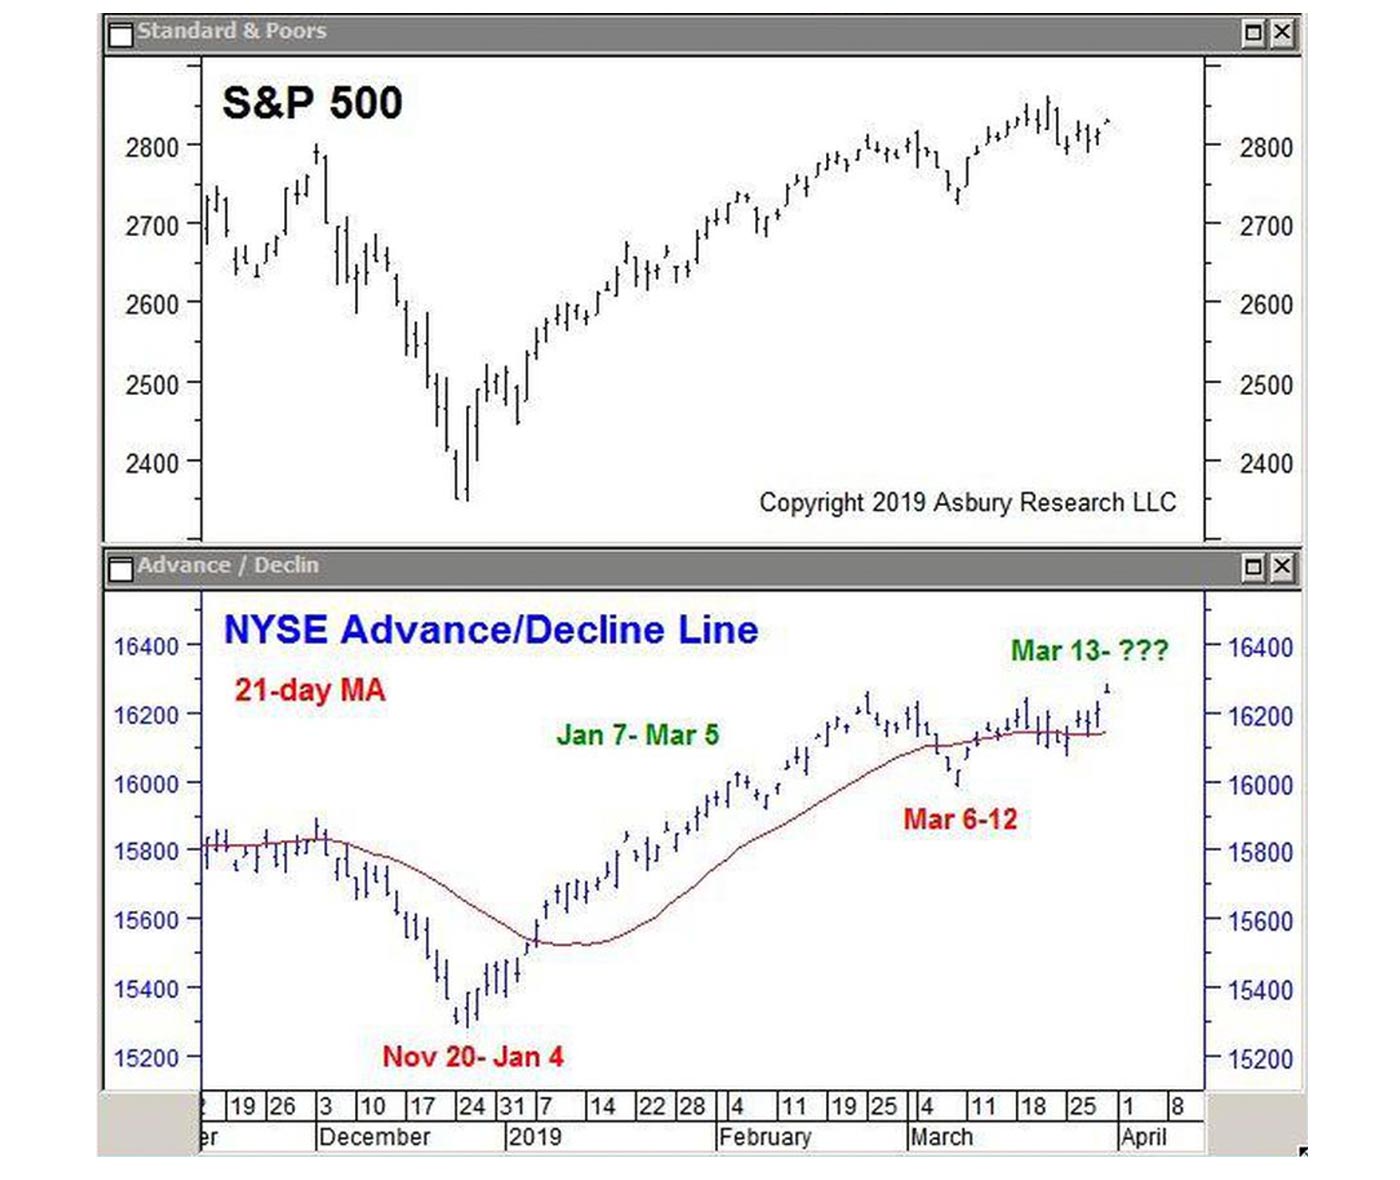
Source: Asbury Research LLC, data through 3/29/19.
The leftmost red text in the lower panel shows that the A/D Line moved below its 21-day moving average on Nov. 20, 2018, and remained there until Jan. 4, 2019, indicating a monthly trend of weakening market breadth. This coincided with a 4% decline in SPX. The green text shows the subsequent rise in the A/D line above its 21-day moving average, indicating a monthly trend of strengthening breadth between Jan. 7, 2019, and March 29 (with the exception of March 6–12). This coincided with the 11% rise in SPX.
Over the past four months, these two market metrics—which are both related to, yet independent of, the actual index level of the S&P 500—first warned of an emerging period of stock market weakness in late November. They then indicated an emerging “risk on” environment less than two weeks after the Dec. 26, 2018, bottom was established—long before there was any clear indication in the S&P 500 that an “investable bottom” was in place.

Some investors might say the U.S. stock market decline in the fourth quarter of 2018 wasn’t enough to actually motivate them to move money out of the market. After all, the market came right back, right? But wouldn’t it have been nice to have a little advance notice that the decline—which was 11% just since Nov. 20—was coming, so you could plan accordingly? And wouldn’t it also have been nice to know there was an opportunity to put some new money to work in mid-January 2019? And what if the decline didn’t stop in late December? After all, this is the 10th year of the current bull market, and a flattening yield curve has been indicating that the prescient bond market has been nervous about the economy for more than a year.
Time horizon is the part of investing that can really change everything. If one of your clients is 30 years old, or even 40, the inherent upward bias of the stock market can overcome a lot of problems in his or her portfolio over time. If a client is 60 or older, however, a big market decline or bear market can drastically change how they live the rest of their lives—especially if you throw in a couple of ill-advised entries and exits into and out of their portfolio.
No one can see the future. However, if you just check under the hood of the market—and you know where to look—you can help clients avoid some serious market breakdowns, especially in the latter part of their financial journey. And you may even find some new opportunities in the process.
The opinions expressed in this article are those of the author and do not necessarily represent the views of Proactive Advisor Magazine. These opinions are presented for educational purposes only.
This is an edited version of an article that first appeared at Forbes.com on April 1, 2019.
 John Kosar, CMT, is chief market strategist and director of research at Asbury Research, which provides institutional research services. Mr. Kosar has more than 30 years of experience analyzing and forecasting global financial markets, having worked as a trader and analyst for several leading Wall Street firms. He is a past member of the board of directors of the Market Technician’s Association (now the CMT Association), is a featured speaker at many financial conferences, and is frequently quoted in the financial press. asburyresearch.com