- Elections in the U.S. and U.K. that confounded pollsters and market watchers.
- Periods of extreme market volatility both here and abroad, followed by unusually long periods of “calm” and range-bound markets.
- The continued role of central banks around the world as the key influencers for economic and market expectations.

While numerous asset classes, sectors, and geographies played a major role in defining 2016, six market charts in particular provide a perspective on some of the most important events of the year.
1. “The worst first week of a new year, ever!”
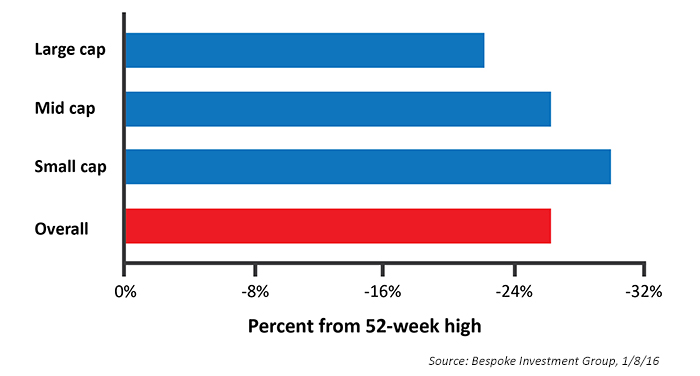
So read many of the headlines in January 2016, as U.S. equity markets began the new year with much more than a whimper. Bespoke Investment Group captured a unique perspective on the early-year decline, saying on January 8, 2016, “Stocks in the S&P 1500 (which includes large-, mid-, and small-cap stocks) were trading on average 26.3% lower on Friday than their respective 52-week highs—that’s bear market territory!”
FIGURE 1: S&P 1500—AVG. STOCK DISTANCE FROM 52-WEEK HIGH
2. “Do negative interest rates pose a global growth threat?”
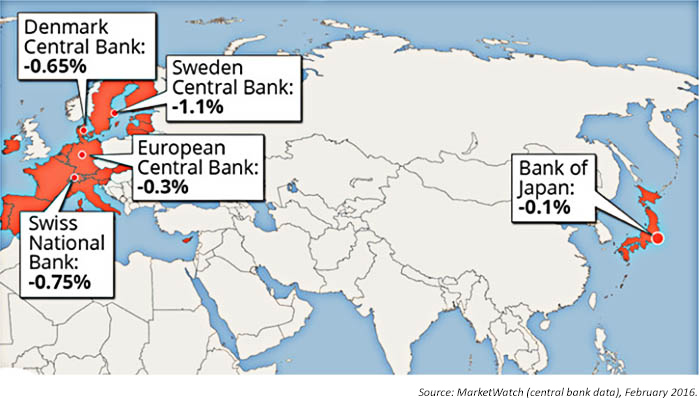
This question was posed in February, as a great deal of the analyst community’s attention was equally focused on interest rates and monetary policy around the globe (not to mention continued intense Fed-watching here in the U.S.). Market observers noted, with some disbelief, that they had never seen a situation where major industrialized countries were operating with an effectively negative interest-rate policy.
FIGURE 2: CENTRAL BANKS WITH NEGATIVE INTEREST RATES
3. “Will ‘Brexit’ doom the U.K.’s economy?”
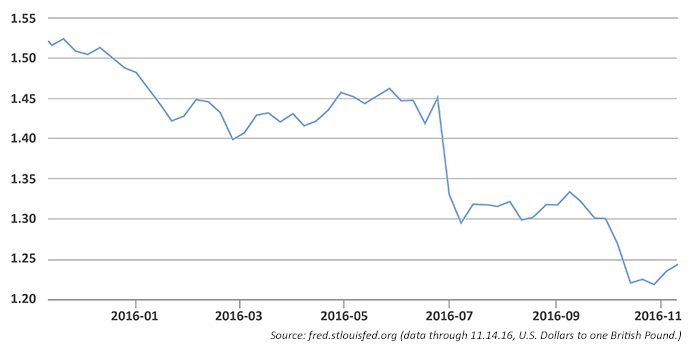
The worst fears of analysts both here and abroad were not manifested (at least not yet), but Brexit will undoubtedly have a profound long-term impact on Britain’s global economic stature. In the relatively short run, the weakness of the British pound sterling (GBP), compared to other major currencies, was one of the most notable Brexit effects.
FIGURE 3: U.S./U.K. FOREIGN EXCHANGE RATE
4. “Is this the end of the U.S. earnings recession?”
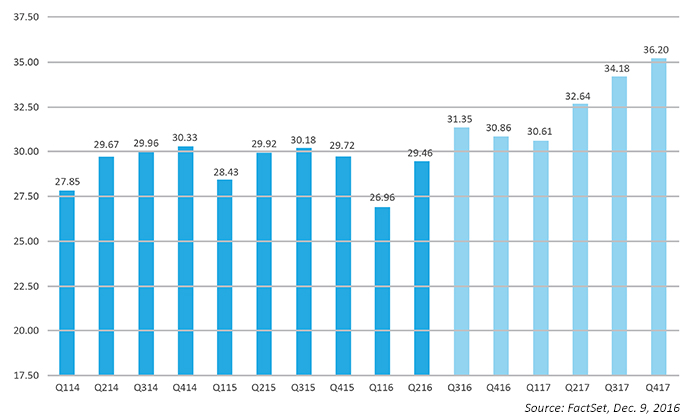
Going-in expectations for the S&P 500 Q3 2016 earnings season were tepid at best. Most analysts were calling for a negative year-over-year earnings decline of around -2.3%. This would have represented the sixth consecutive quarter of year-over-year earnings declines.
Instead, companies in the S&P 500 posted a year-over-year EPS increase for Q3 2016 of 3.9%, according to FactSet’s latest data. While FactSet does not see absolute earnings growth for the next two quarters, expectations pick up considerably starting with Q2 2017.
FIGURE 4: S&P 500 QUARTERLY EPS ACTUALS AND ESTIMATES
5. “Have we seen the last of the great bond bull market?”
While many market strategists still see ways for fixed-income maneuvering in a higher interest-rate environment, there seems little doubt that at least an intermediate-term bottom has been established for bond yields. Said The Wall Street Journal on December 9:
“Prophetic calls about bonds have made many prognosticators look silly. … But the recent rout in the bond market following the presidential election has left investors contemplating what a world of higher interest rates, more inflation and perhaps even stronger growth could mean for financial markets. The assumption is that expansive fiscal policy and a less cautious Federal Reserve should mean even higher yields.
The 10-year Treasury yield has jumped more than a percentage point from its record low over the summer, hitting a 17-month high of 2.492% earlier this month. This marks only the third time in the current economic expansion that the benchmark yield has risen by at least that much.”
FIGURE 5: U.S. 10-YEAR TREASURY BOND YIELD (ONE-YEAR TREND)

6. “Does the ‘Trump growth rally’ have staying power into 2017 and beyond?”
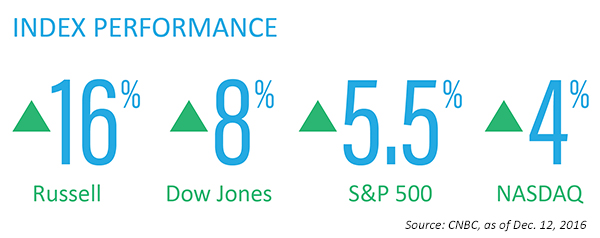
More than one prominent economist predicted that a victory by Donald Trump would ultimately lead to recession and a severe pullback in the U.S. stock market. As everyone watching the market knows, this has hardly been the case so far, with the post-election rally lifting index after index to new all-time highs. In just over one month since the election, the gains have been impressive, especially for small- and mid-cap stocks.
FIGURE 6: THE TRUMP RALLY (11/9/16–12/12/16)
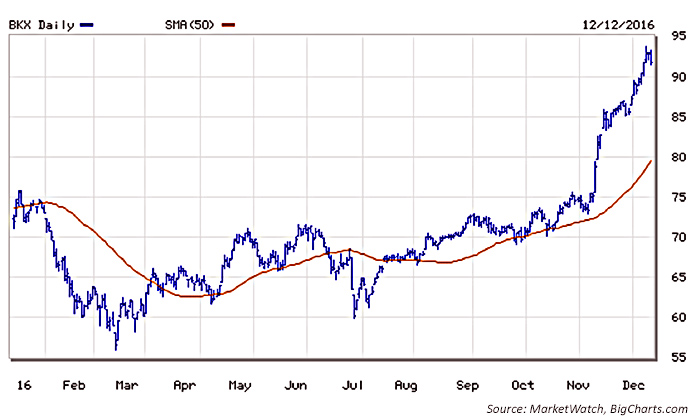
The banking and financial sectors have been major beneficiaries of the post-election rally and the prospect of higher interest rates. Through December 9, the Dow Jones financial sector index (DJUSFN) was up about 16% for the year, and the KBW Bank Index (BKX) has gained over 27% year to date.
FIGURE 7: KBW BANK INDEX (BKX) VS. 50-DAY MOVING AVERAGE (ONE-YEAR TREND)
