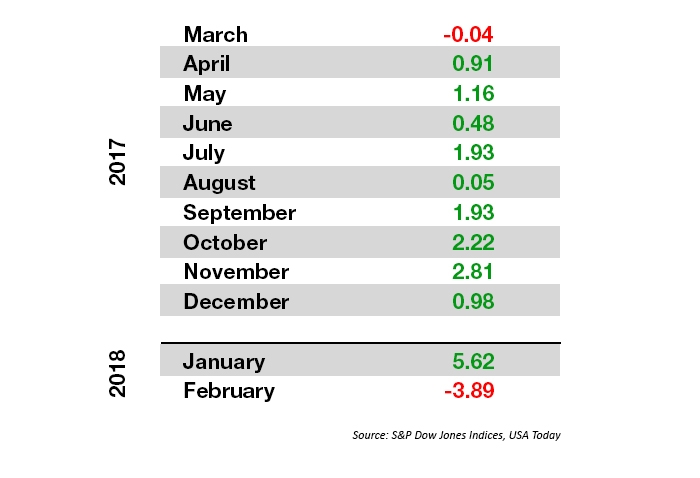
The S&P 500 Index recorded its first monthly price decline since March 2017, ending February 2018 with a loss of 3.9%. On a total-return basis, the S&P 500’s 15-month streak of gains came to a close.
USA Today wrote last week,
“The fall was also its biggest monthly decline since January 2016, when investors stepped back from stocks because of concerns that China’s economy was in danger of a major contraction. This February was a turbulent period, which saw the return of wild price swings for stocks after a long period of calm. The volatility—including two days in which the Dow Jones industrial average suffered record point drops of more than 1,000 points—was set in motion by fears that borrowing costs would spike more than expected this year, threatening to slow growth for the economy and stocks.”
FIGURE 1: S&P 500 MONTHLY CHART (2016–2018)
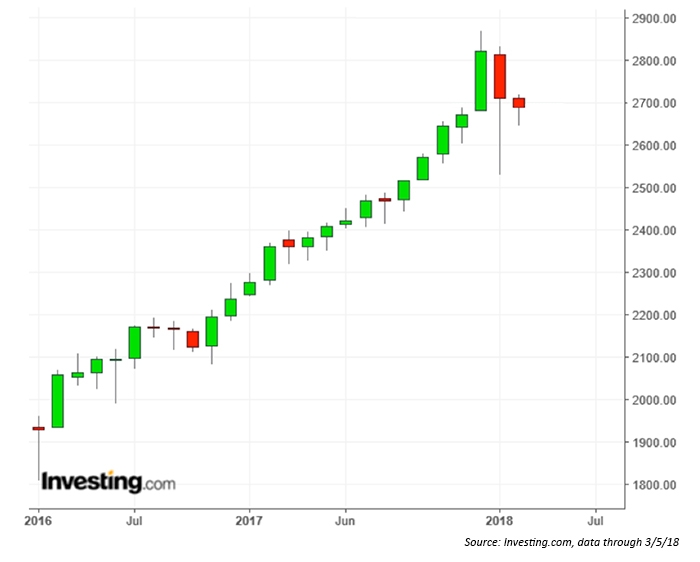
TABLE 1: S&P 500 % MONTHLY RETURNS
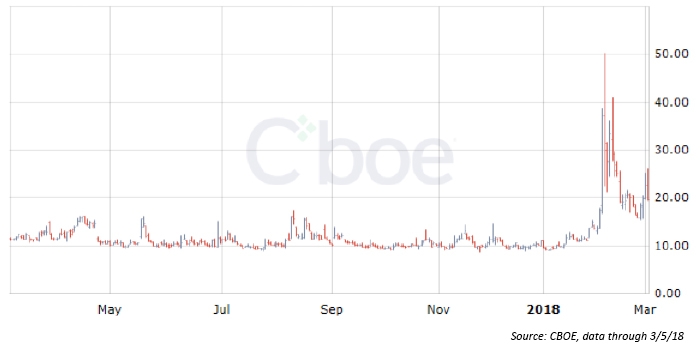
Perhaps the biggest market story of February was the return of volatility, as USA Today points out. After a lengthy period of relative calm, the CBOE Volatility Index (VIX) spiked to just over 50 on February 6, 2018. It has remained elevated compared to levels seen in 2017, staying in the 18–22 range for the past two weeks.
FIGURE 2: CBOE VOLATILITY INDEX
At the beginning of this week, Asbury Research noted four factors that might represent positives for the S&P 500’s intermediate expectations:
“The key near term message in the data this week is that the U.S. broad market is amid favorable if not ideal conditions to resume its March 2016 major uptrend due to the S&P 500’s (SPX) recent test and rebound from major underlying support at its 200-day moving average, extremes in the CBOE Put/Call Ratio, money market asset flows, and investor sentiment. That is, IF this major trend is still valid and intact.”
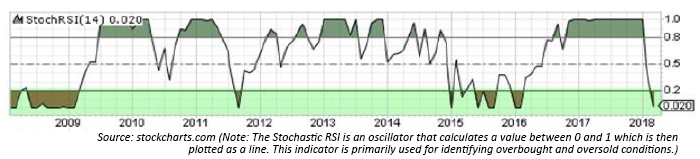
One of those factors, the CBOE Put/Call Ratio, can act as a contrarian indicator. When the ratio reaches extremes of “bearishness,” according to Asbury Research, it “has previously coincided with most of the minor bottoms in the S&P 500 during the past year.” In further support of this premise, U.S. stocks have reached a significant oversold position as measured by the Relative Strength Index (Stochastic RSI) for the first time since early 2016.
FIGURE 3: CBOE PUT/CALL RATIO—5-DAY MOVING AVERAGE (INVERSE SCALE)
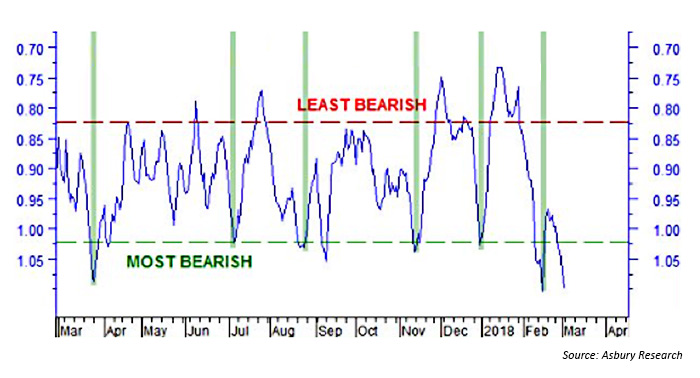
FIGURE 4: RELATIVE STRENGTH INDEX (STOCHASTIC) FOR S&P 500